
Figure 2. Examples of Coordinated AS Activity, Involving SNVs and SVs.
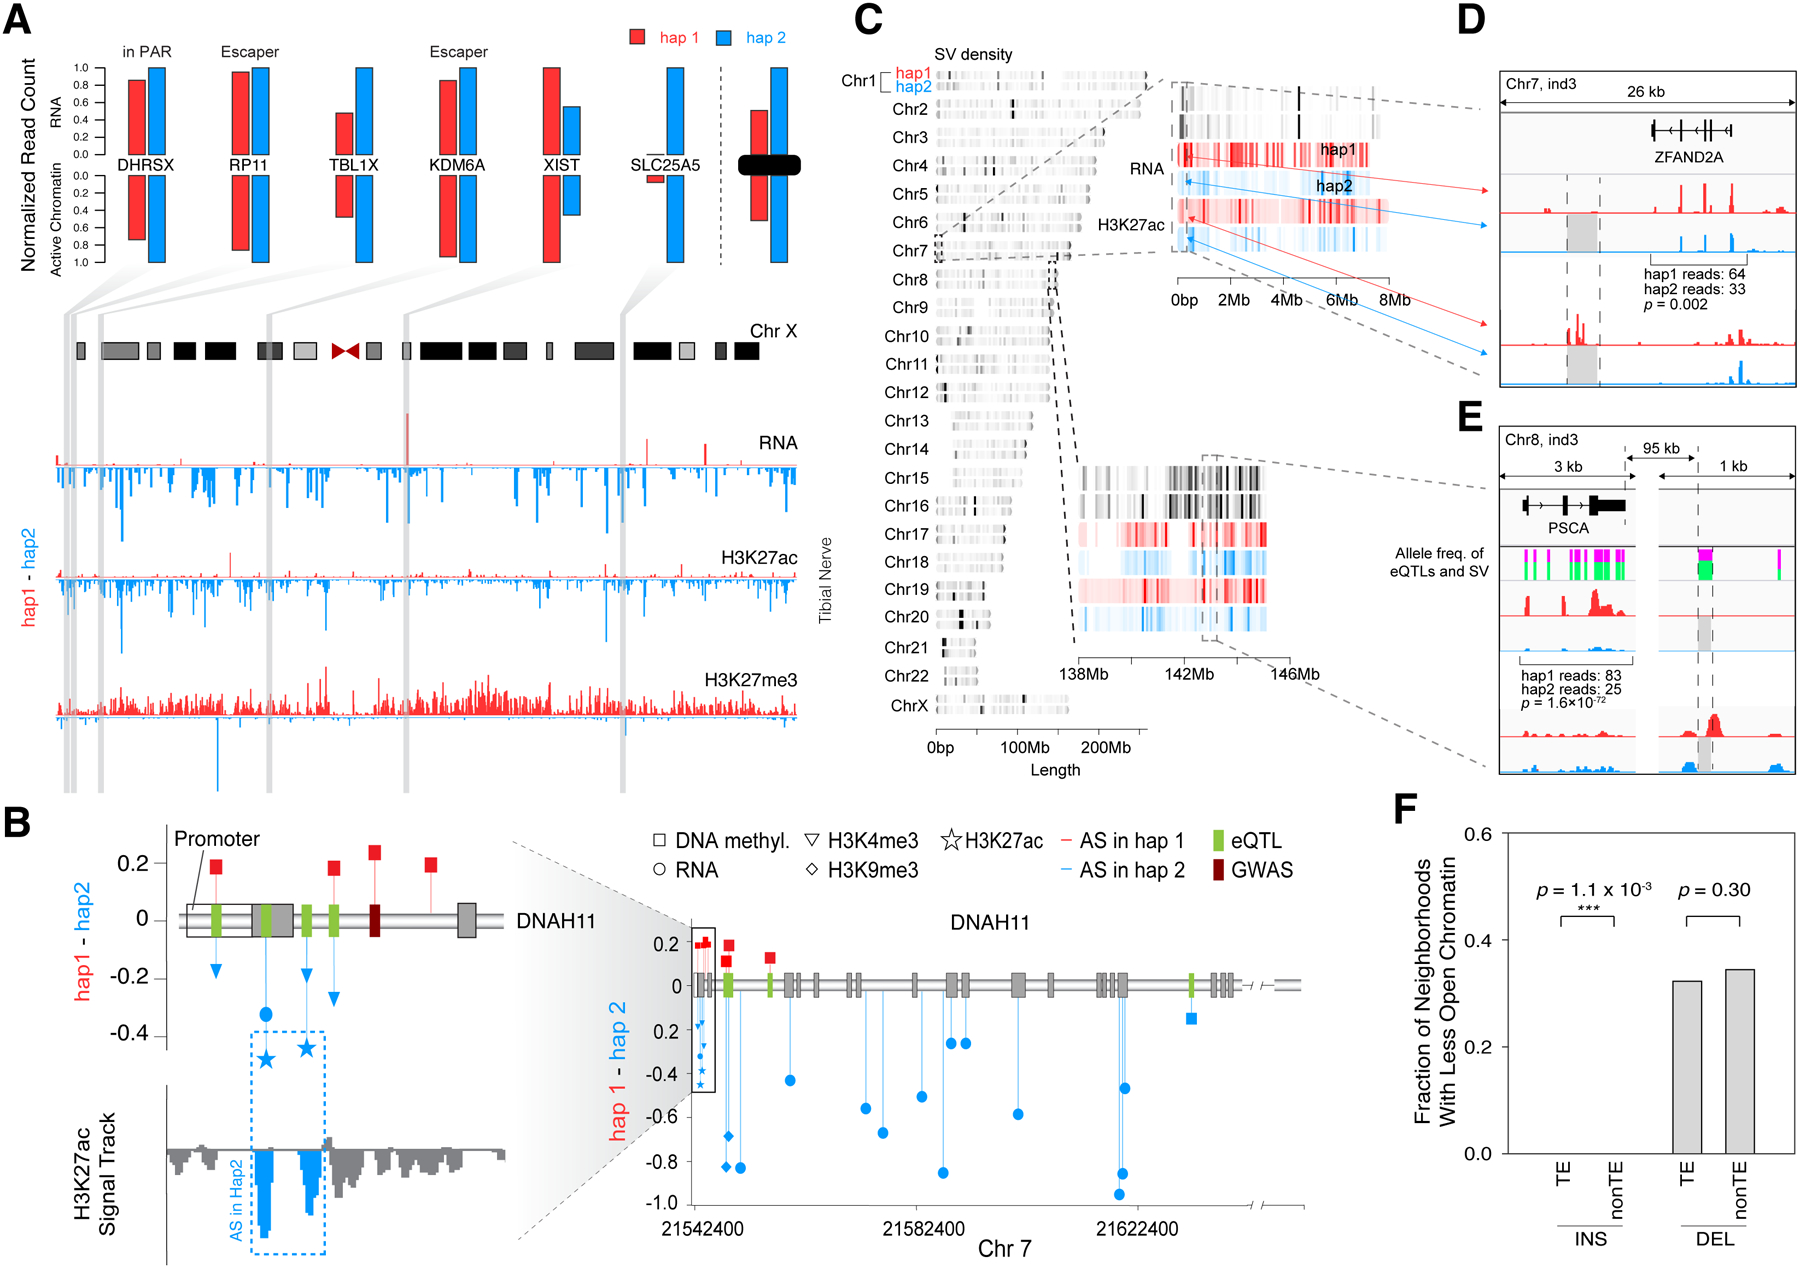
(A) Detecting coordinated AS activity across a chromosome. Signal tracks (bottom) show that for chrX in the tibial nerve of individual 3, hap1 generally has lower expression levels, lower H3K27ac levels, and higher H3K27me3 levels than hap2. The top bar-graphs show the expression and active promoter chromatin of 6 selected genes. (Details in Data S14.)
(B) AS events at a disease-associated locus: the DNAH11 gene. The lollipop diagrams show the degree of AS imbalance for various assays at heterozygous SNPs in individual 1. Those that are GTEx eQTLs and GWAS loci are highlighted. (Details in STAR Methods “AS Examples” Section.)
(C) The chromosomal distribution of SVs on the diploid genome. Colors indicate the density of SVs. Genomic regions of chr7 and chr8 (in individual 3) are enlarged to show the positions of detected SVs and the levels of H3K27ac and RNA expression obtained from transverse colon.
(D) The effect of a 2.6 kb deletion. The deletion in hap2 removed several H3K27ac peaks and reduced ZFAND2A expression in thyroid. (Details in Data S17C–D.)
(E) The effect of a 98-bp deletion. The deletion in hap2 in individual 3 removed a H3K27ac peak in colon downstream of PSCA, potentially contributing to reduced expression. The heights of the green bars indicate the allele frequencies of the deletion and the surrounding GTEx eQTL SNVs, indicating they are potentially in linkage disequilibrium. (Details in Data S17G–H.)
(F) Overall effect of TEs on chromatin. The genomic regions neighboring the TE insertions show reduced chromatin accessibility more often than those of the non-TE insertions. (Details in Data S18 and STAR Methods “SVs” Section.)