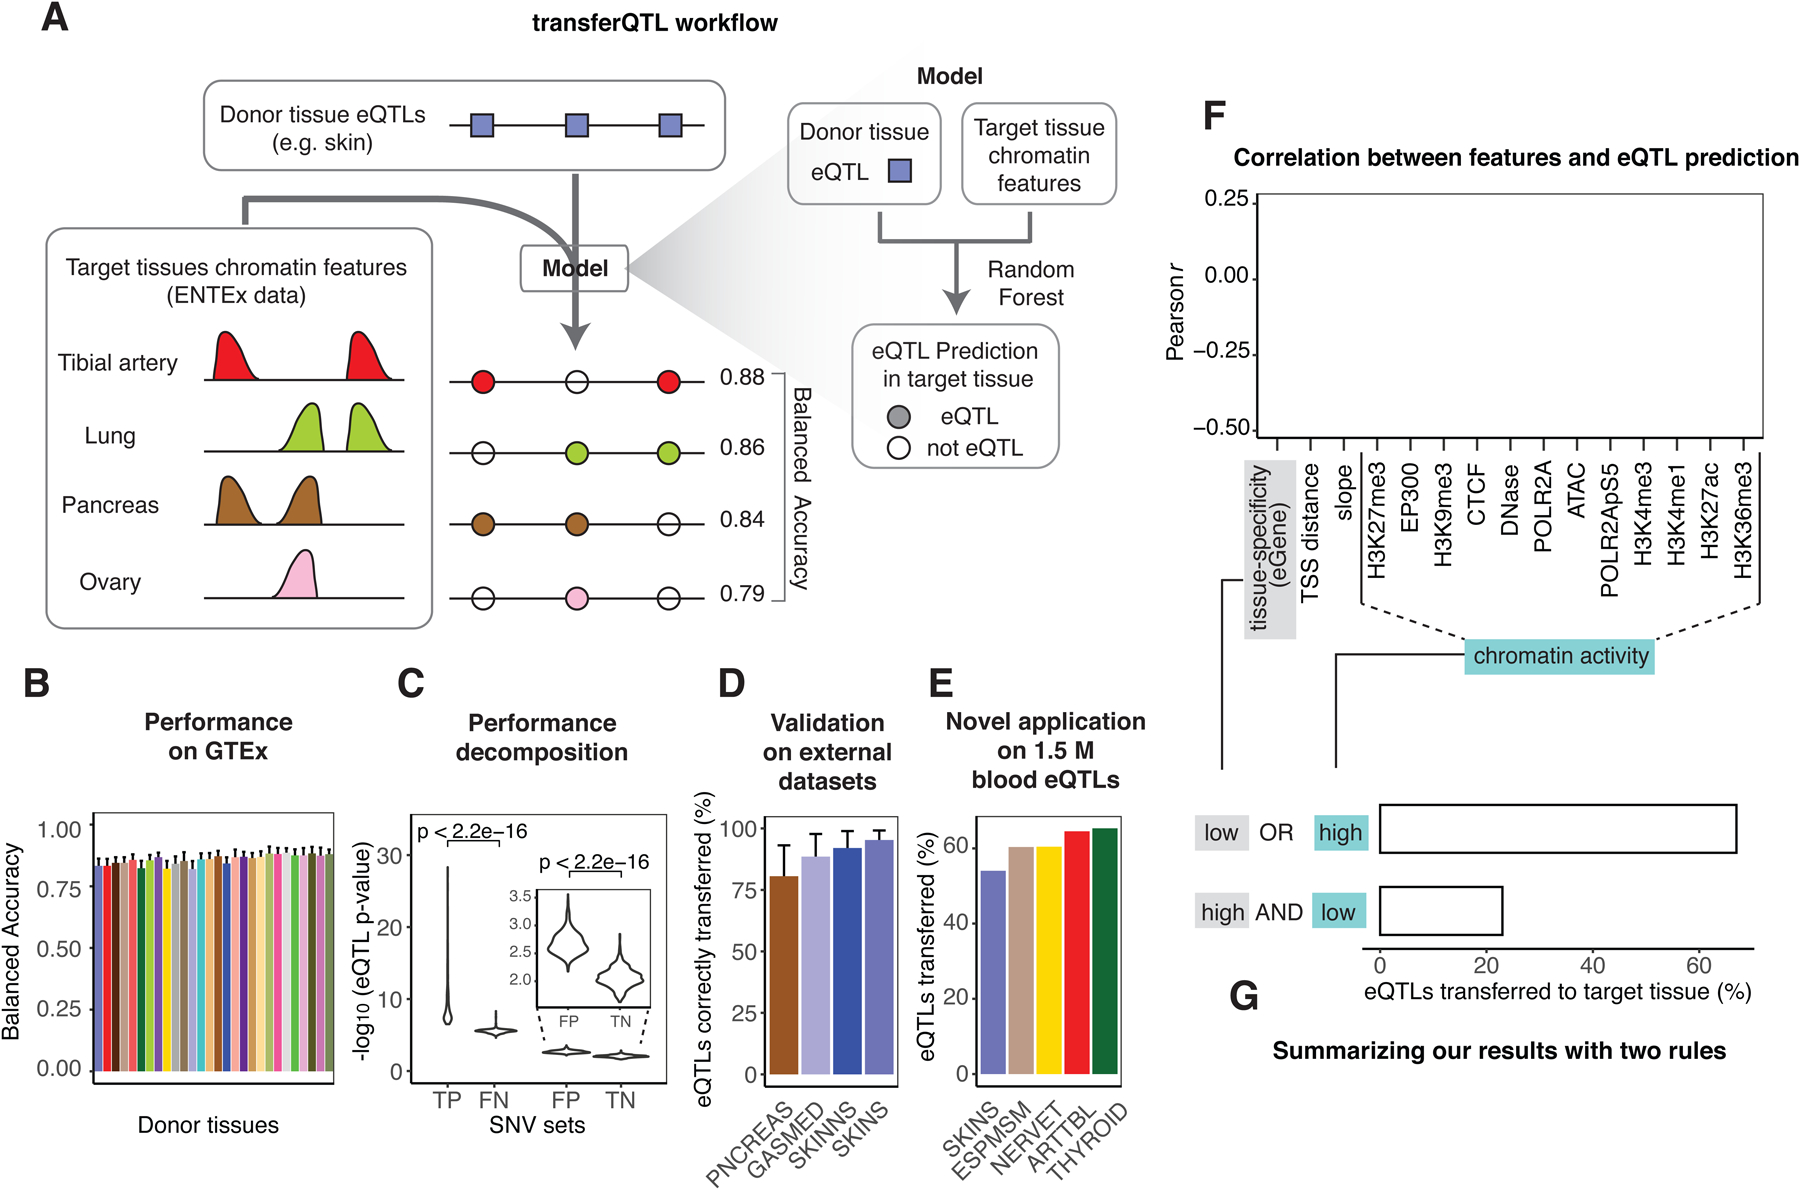
Figure 5. Aspects of Application 2: Modeling eQTLs in Hard-to-obtain Tissues.

(A) Schema of the transferQTL model. For a catalog of eQTLs active in a source tissue (donor), we transfer them to another tissue (target) by leveraging the chromatin in the target and other features. (Details in Figure S6C.) For several representative target tissues the balanced accuracy is shown for transferring skin eQTLs.
(B) Performance of the model. The X-axis indicates the tissues used as the donors (GTEx coloring), and the Y-axis indicates the average performance (balanced accuracy) across the target tissues. The whiskers indicate variation across targets (standard deviations). (Details in Data S28CD.)
(C) Performance decomposition. For the confusion matrix resulting from applying the model to known GTEx eQTLs, we plotted the distribution of mean p-values on each subset.
(D) External validation. We validated our transferred eQTLs against four eQTLs catalogs other than GTEx: pancreas (PNCREAS), skeletal muscle (GASMED), suprapubic skin (SKINNS), and lower-leg skin (SKINS). The Y axis corresponds to the sensitivity of the prediction (TP / (TP + FN)). (Details in the STAR Methods “transferQTL Model” Section.)
(E) Large-scale application. We applied the model to a set of ~1.5 M eQTLs from blood (as donor). We were able to transfer a large proportion of these to EN-TEx target tissues. The plot shows the five tissues with the largest fractions transferred. (Details in Data S28F–G.)
(F) Importance of the features in the model. We computed the correlation between 15 selected features and the model’s probability of classifying donor-tissue eQTLs as eQTLs in the target tissue. The bar plot shows, for each feature, the strongest correlation observed across all 756 donor-target tissue pairs. (Details in Data S29A.)
(G) Schematic showing how two simple rules help predict eQTLs in a target tissue. To summarize F, we have found that two observations help define transferQTL. As an example, we show the results obtained when transferring eQTLs from testis (donor) to thyroid (target). (Details in STAR Methods “transferQTL Model” Section and Data S29B.)
