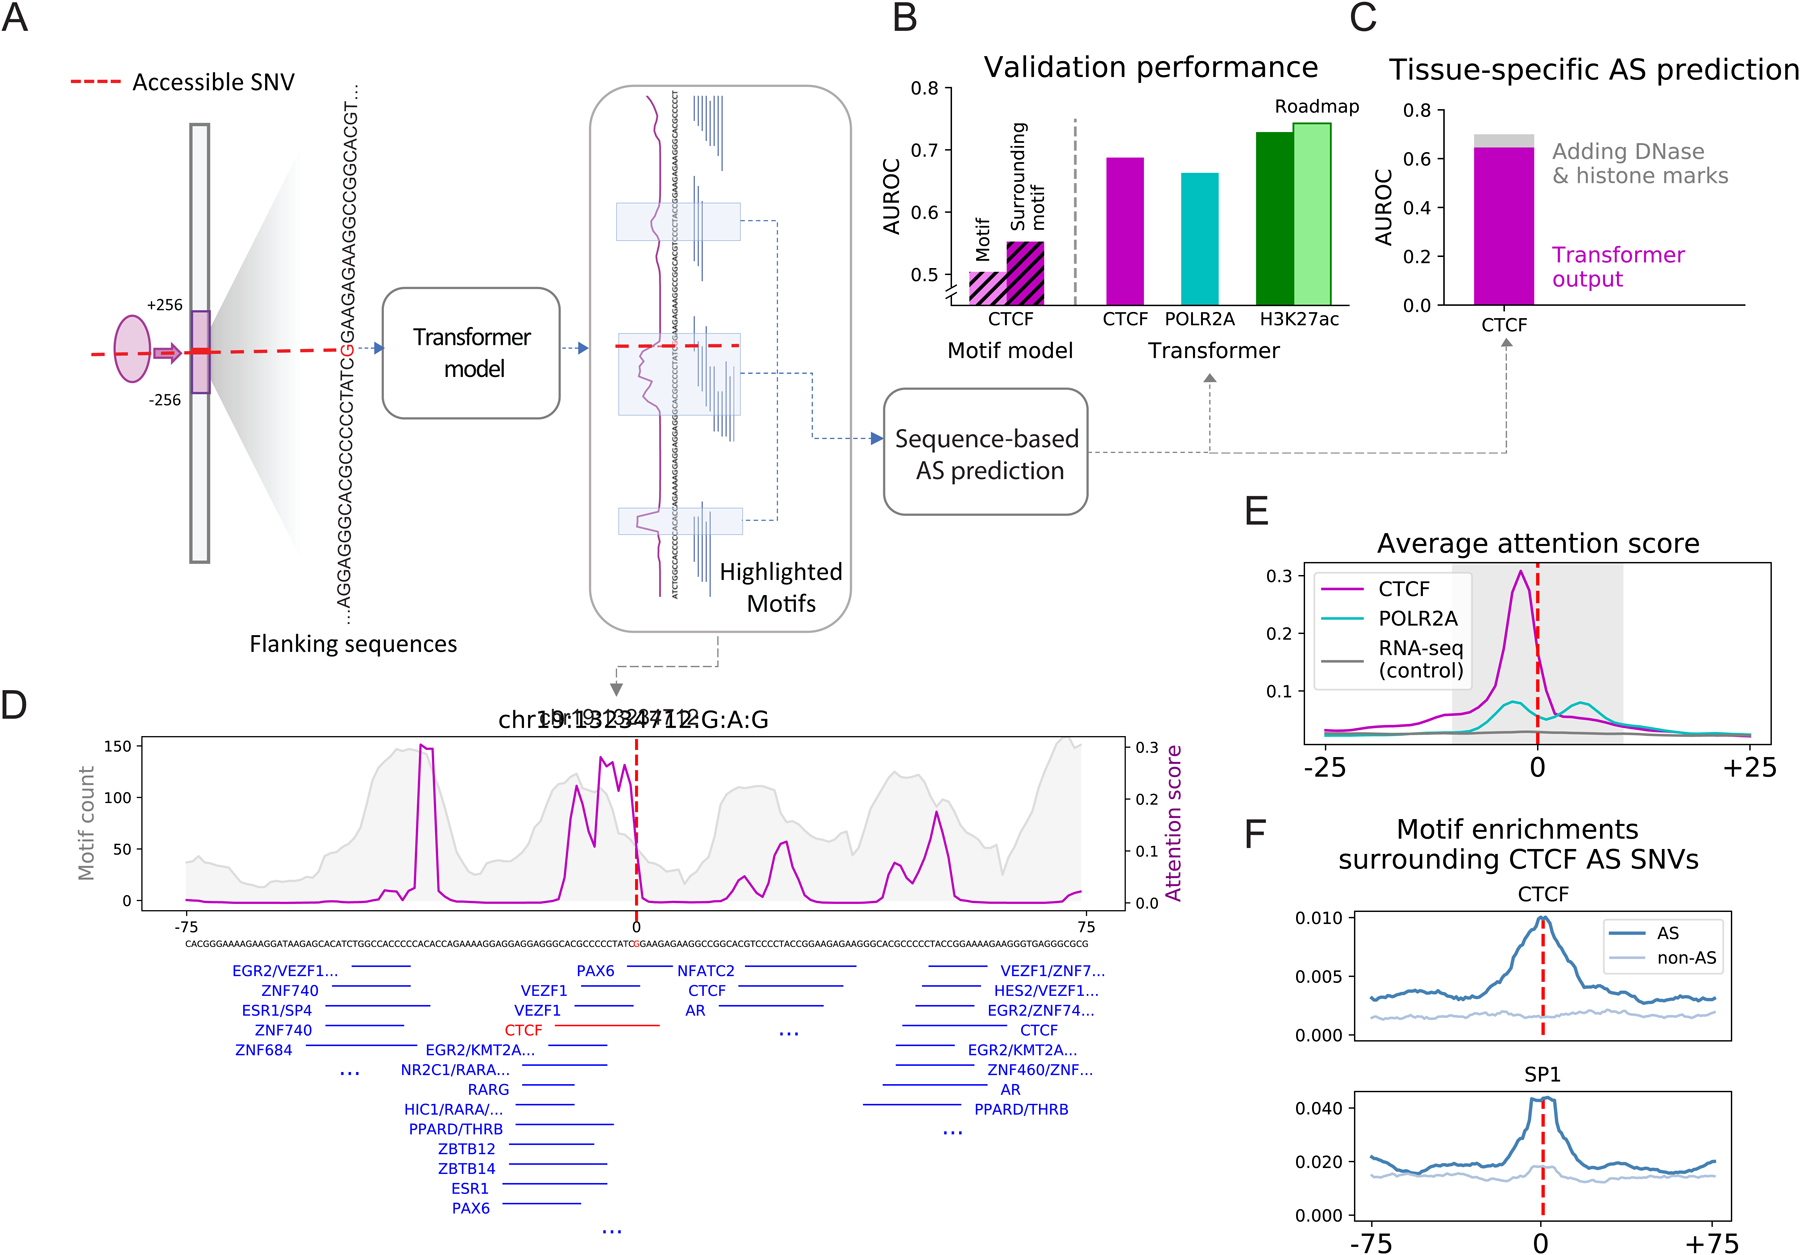
Figure 7. Aspects of Application 3: Deep-learning Model Predicting AS Activity from Nucleotide Sequence.

(For all sub-panels, details are in Figure S7, Data S32, and STAR Methods “Transformer Model” Section.)
(A) Schematic of the sequence-based predictive model. A transformer model was trained on the flanking regions (128 bp) of accessible SNVs to predict whether or not they are AS. The attention score (magenta lines) reflects the weights the model attaches to different nucleotide positions in the input sequences.
(B) Average performance of models predicting AS activity. As a reference, the CTCF model was compared to simple logistic regression models with the only information being (1) CTCF-motifs overlapping the SNV or (2) CTCF-motifs in a neighborhood around the SNV. For the H3K27ac model, the prediction was also validated against external data from Roadmap.
(C) Performance of a tissue-specific model for CTCF. Adding epigenomic features only marginally improved the performance over just sequence features.
(D) Attention patterns learned by the model. Those in the flanking regions of a selected CTCF AS SNV (magenta) show strong consistency with motif enrichment (gray). The central peak surrounding the SNV contains a CTCF motif, highlighted in red.
(E) Average attention pattern of sequence-based models for various assays.
(F) Motif enrichment surrounding the AS CTCF SNV agrees with the average attention pattern in E.
