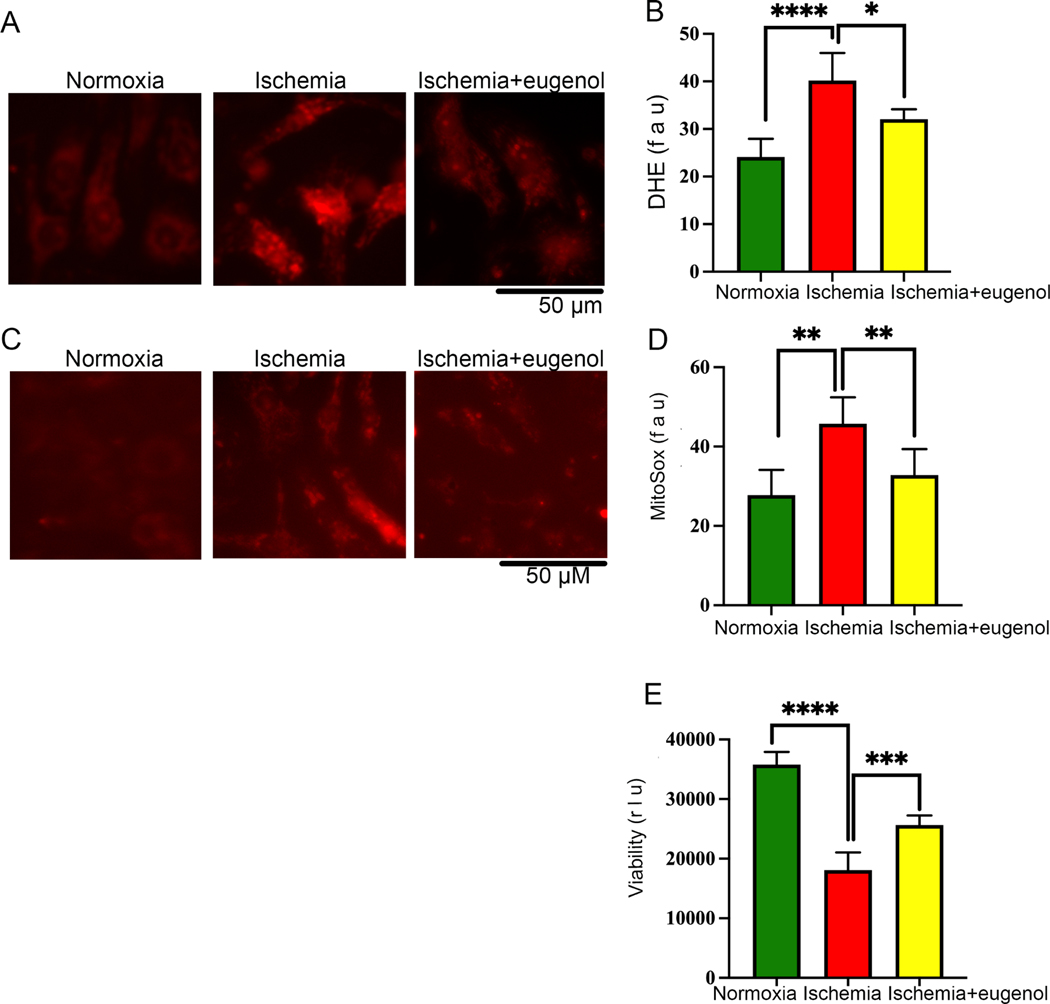
Figure 5: Eugenol treatment reduces the free radical generation in cardiomyocytes during ischemia.
NRVCs were exposed to normoxia and ischemic condition for 24 h and then stained with the DHE stain and MitoSox stain and live cell imaging was done with the Keyence florescence microscope. (A-B) Representative microscopic images show NRVCs stained with DHE and the graph shows quantification of DHE staining. (C-D) Representative microscopic images show NRVC stained with MitoSox and the graph shows quantification of MitoSox staining. Quantification was done by ImageJ software. (*, p value<0.05; ****, p value<0.0001). (E) The graph displays the effect of normoxia, ischemia and eugenol in the presence of ischemia on cell viability (***, p value<0.05; ****, p value<0.0001). Cellular viability of NRVCs were determined in presence of eugenol using CellTiter-glow reagent.

