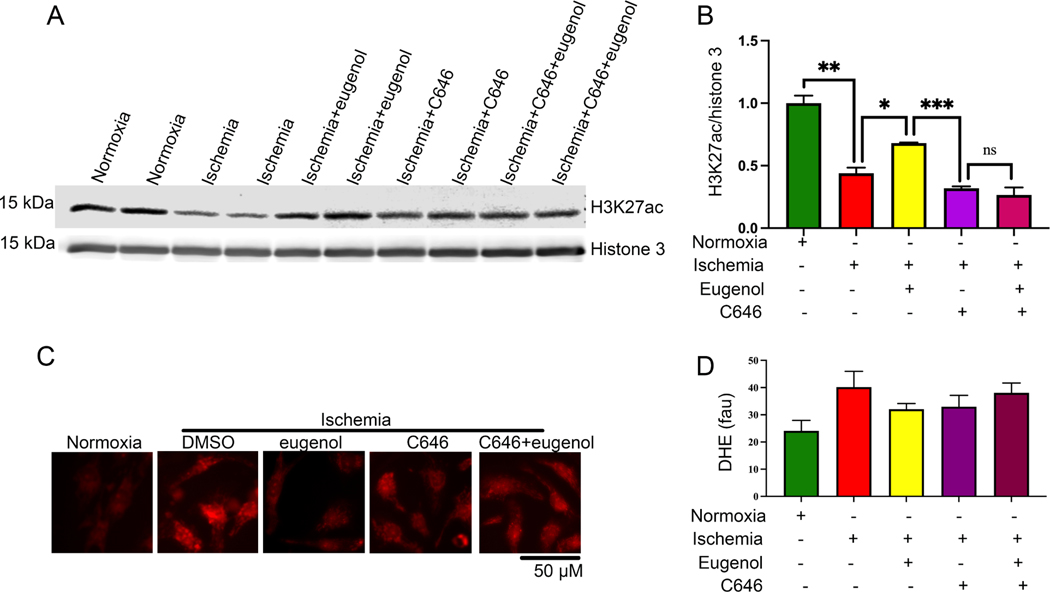
Figure 6: (A-B) HAT blocker inhibits the eugenol mediated acetylation of histone during ischemia.
(A-B) The western blot shows the changes in H3K27ac during normoxia, ischemia, in the presence of eugenol under ischemic conditions, C646 (1μm) (HAT blocker), Eugenol+C646 (1μm) under ischemic conditions. The graph shows the quantification data (*, p value<0.05; **, p value<0.05; ****, p value<0.0001). (C-D) Representative microscopic images show cardiomyocytes stained with DHE. NRVCs were subjected to normoxia, ischemia, eugenol, C646 (1μm) under ischemic conditions, Eugenol+C646 (1μm) under ischemic conditions and thereafter stained with DHE. The graph displays the quantification data of free radical generation during normoxia, ischemia, eugenol in the presence of ischemia, C646 (1μm), Eugenol+C646 (1μm) under ischemic conditions, (*, p value<0.05; ****, p value<0.0001)

