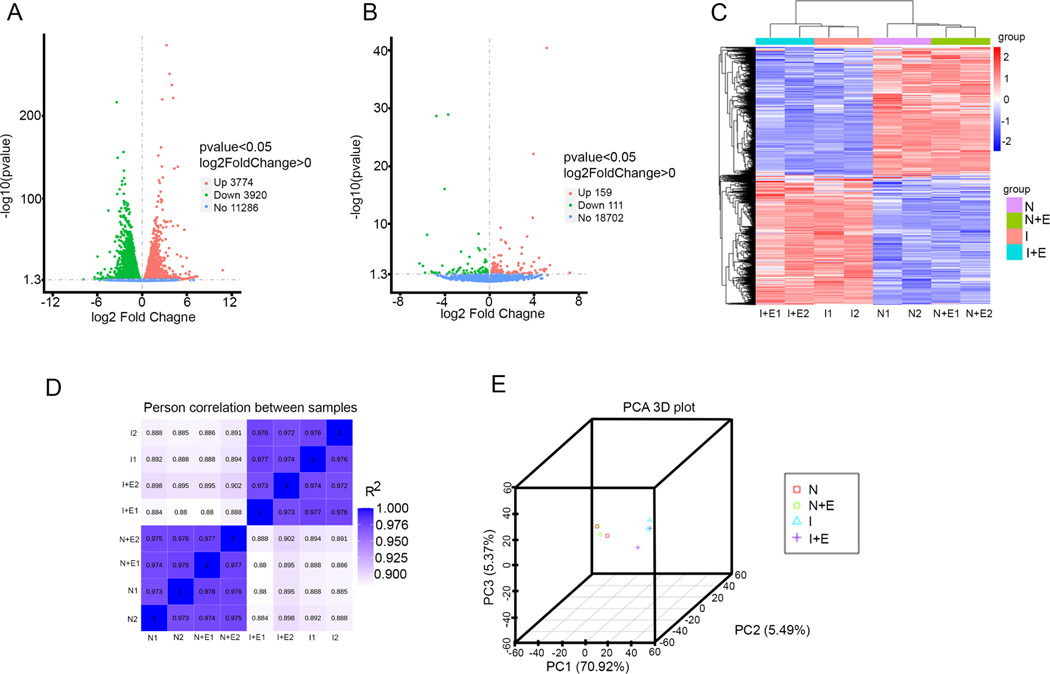
Figure 7:
Differential expression analysis of RNA -seq data from NRVCs treated with eugenol and exposed to ischemic condition. (A) Volcano plot shows the differentially expressed genes in the NRVCs exposed to ischemic condition. (B) Volcano plot shows the differentially expressed genes in the eugenol treated NRVCs during ischemic condition. (C) A heat map shows comparison of differentially expressed genes in between NRVCs exposed to normoxia, normoxia with eugenol, ischemia, and ischemia with eugenol condition for 24 hours. (D) The figure indicates the Pearson correlation between the samples. (E) The figure shows principal component analysis (PCA) of RNA-seq data.

