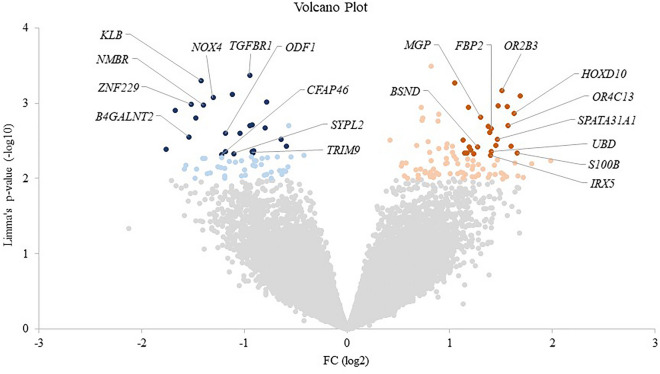
Figure 3.
Volcano Plot for all probes included in PBC microarray analysis after background correction, normalization and merging of the replicated probes. The negative log10 of Limma’s test p-value for each probe are plotted against the difference (expressed as fold change, FC, log10 value) between children with low vs. high MVPA levels. Genes with p-value < 0.01 with positive FC (up-regulated in low MVPA children vs. high) are represented in orange and with negative FC (down-regulated in low MVPA children vs. high) are in blue. In addition, the 25 up- and down-regulated genes with p-value < 0.005 appear in darker color. The names of the top-10 up- and down-regulated genes with known function are also indicated.

