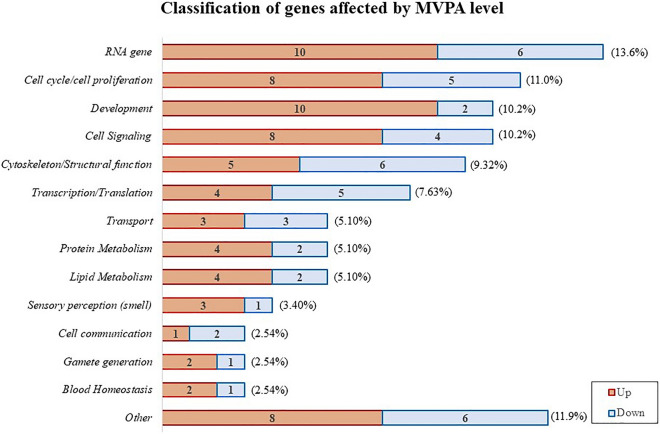
Figure 4.
Classification of the 118 known genes differently expressed (p < 0.01) depending on children’s MVPA levels (low or high), into biological processes according to their main biological function. The numbers of up- (red) or down- (blue) regulated genes in children with lower physical activity versus those with higher activity are also indicated. The percentage of genes in each biological function vs. total differentially expressed are shown in parentheses.

