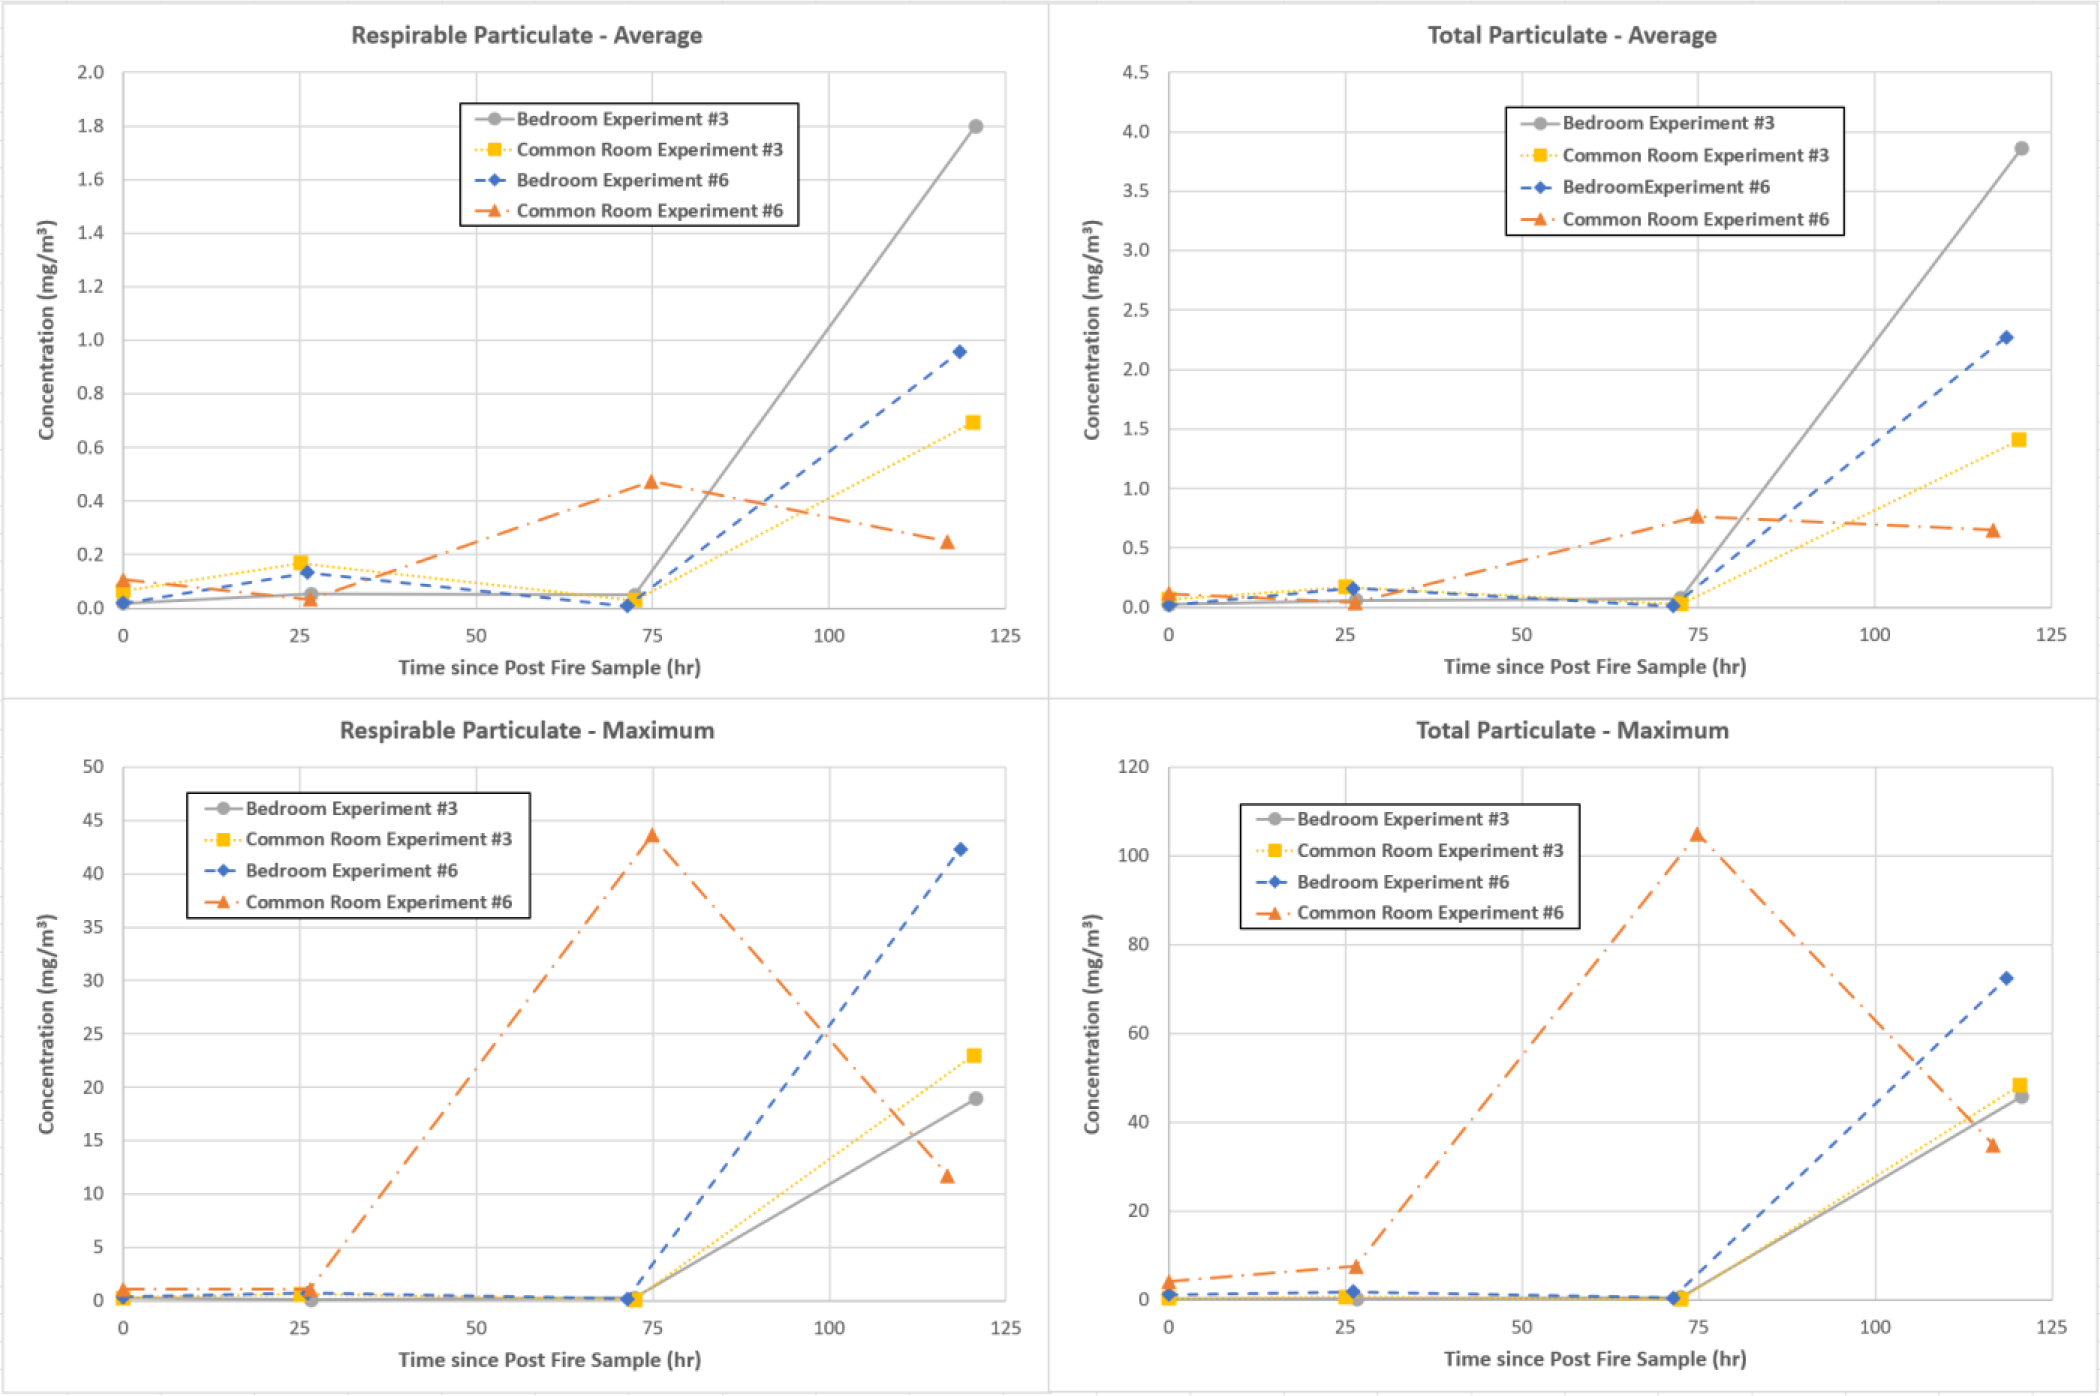
Figure 4.

Respirable (left) and total (right) 60-minute average (top) and peak (bottom) particulate concentrations (μg/m3) for four experiments including Hot Scene B (immediately post-fire sample at time = 0 hour), Warm Scene (1-day and 3-day post fire samples at approximately 24 and 72 hours) and Cold Scene (5-day post fire samples at approximately 120 hours).
