
Figure 3. Heat map of significantly changed metabolites in the heart metabolomes from WT and diabetic mice.
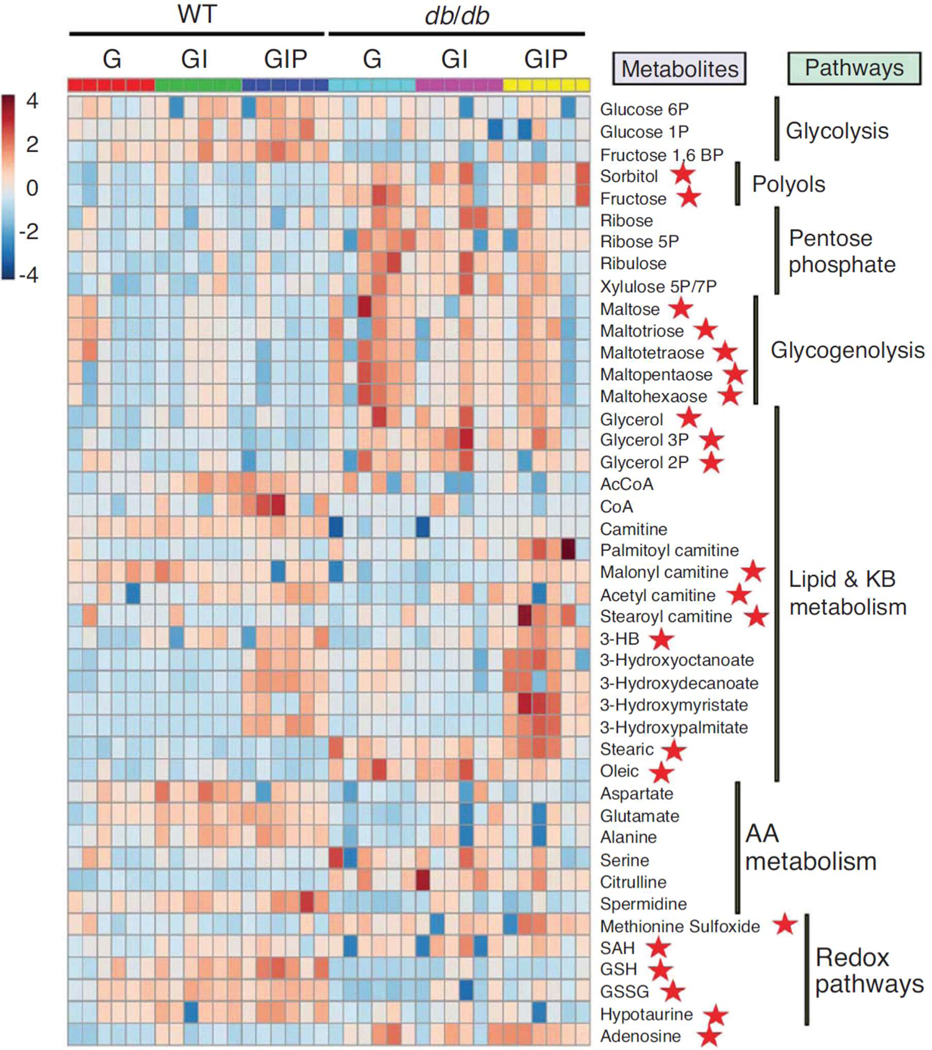
The relative abundance of intermediates from different pathways in WT and db/db hearts is displayed under the different experimental conditions assayed, as described in the text. Depicted is the heat map of the normalized levels of 43 metabolites mainly responsible for the separation between groups (WT, db/db) and treatments (G, GI,GIP) (see Fig. 2) from central glucose and FA degradation pathways, along with redox-related pathways such as methionine cycle and transsulfuration routes. The heat map was constructed using the web-based resource MetaboAnalyst 3.0. Graded pseudo-colours brown and blue correspond to metabolites accumulation or depletion, respectively, according to the scale placed at the left of the plot. AA, amino acid; GSH, reduced glutathione; GSSG, oxidized glutathione; 3-HB, 3-hydroxybutyrate; KB, ketone body; SAH, S-adenosylhomocysteine.
Reproduced from Cortassa, Caceres, Tocchetti, Bernier, de Cabo, Paolocci, Sollott, and Aon (2020) J. Physiol. 598.7, 1393–1415.