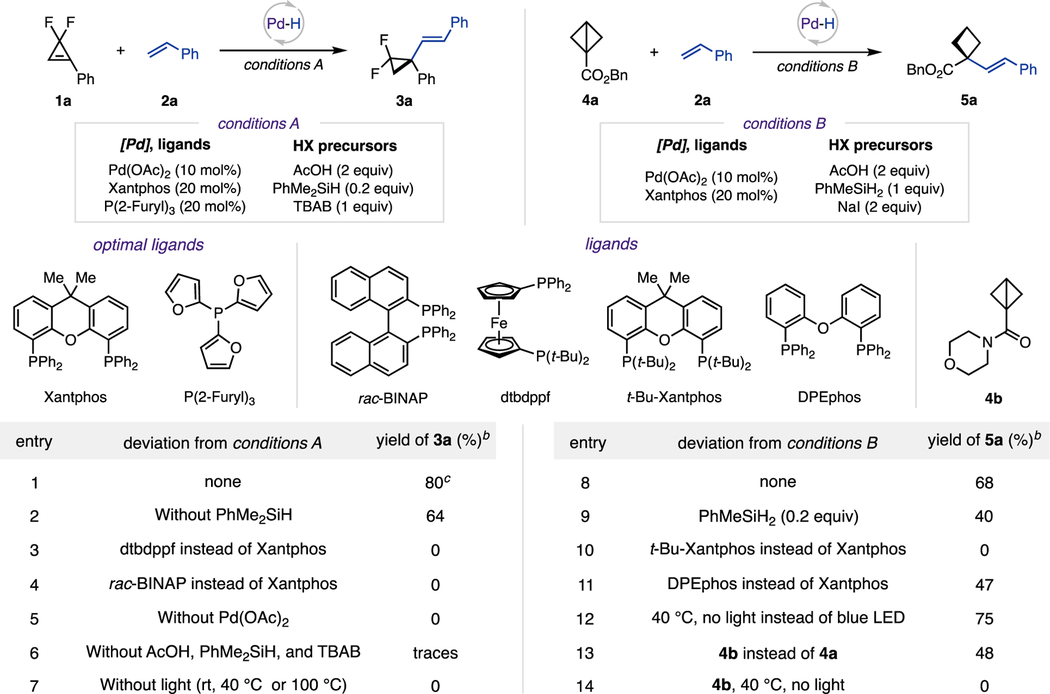
Table 1.
Reaction Optimization and Control Experimentsa

|
0.1 mmol scale; 1a:2a = 1:2. 4a:2a = 1:2. Conditions A: Pd(OAc)2 (10 mol %), Xantphos (20 mol %), P(2-Furyl)3 (20 mol %), acetic acid (2 equiv), PhMe2SiH (0.2 equiv), TBAB (1 equiv), 1,4-dioxane (0.15 M), blue LED (40 W, 427 nm), 16 h. Conditions B: Pd(OAc)2 (10 mol %), Xantphos (20 mol %), acetic acid (2 equiv), PhMeSiH2 (1 equiv), NaI (2 equiv), DCE (0.15 M), blue LED (40 W, 427 nm), 16 h.
Yields were determined by 1H NMR spectroscopy using CH2Br2 as an internal standard.
0.15 mmol scale, isolated yields.
