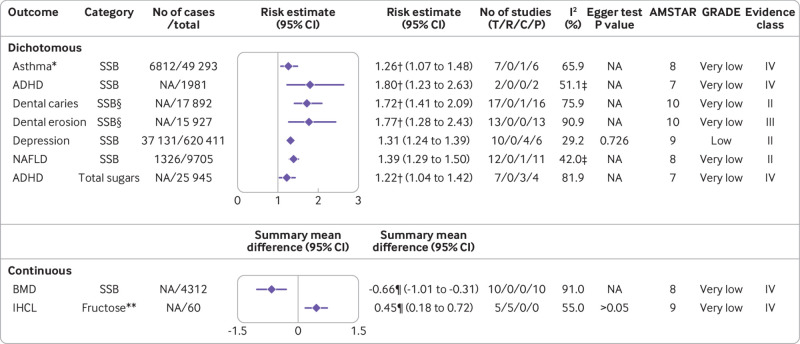
Fig 6.
Significant non-dose-response relations between dietary sugar consumption and other outcomes. Comparisons are highest versus lowest, estimates are relative risks, summary mean difference is weighted mean difference, and effect models are random unless noted otherwise. Complete associations between dietary sugar consumption and other outcomes are shown in supplementary table D. ADHD=attention deficit/hyperactivity disorder; AMSTAR=a measurement tool to assess systematic reviews; BMD=bone mineral density; C=cohort studies; CI=confidence interval; GRADE=Grading of Recommendations Assessment, Development and Evaluation; IHCL=intrahepatocellular lipids; NA=not available; NAFLD=non-alcoholic fatty liver disease; P=population based case-control and/or cross sectional studies; R=randomised controlled trials; SSB=sugar-sweetened beverage; T=total No of studies. *Children. †Odds ratio. ‡Fixed effects model. §Never/low versus moderate/high consumption. ¶Standardised mean difference. **Any versus none

