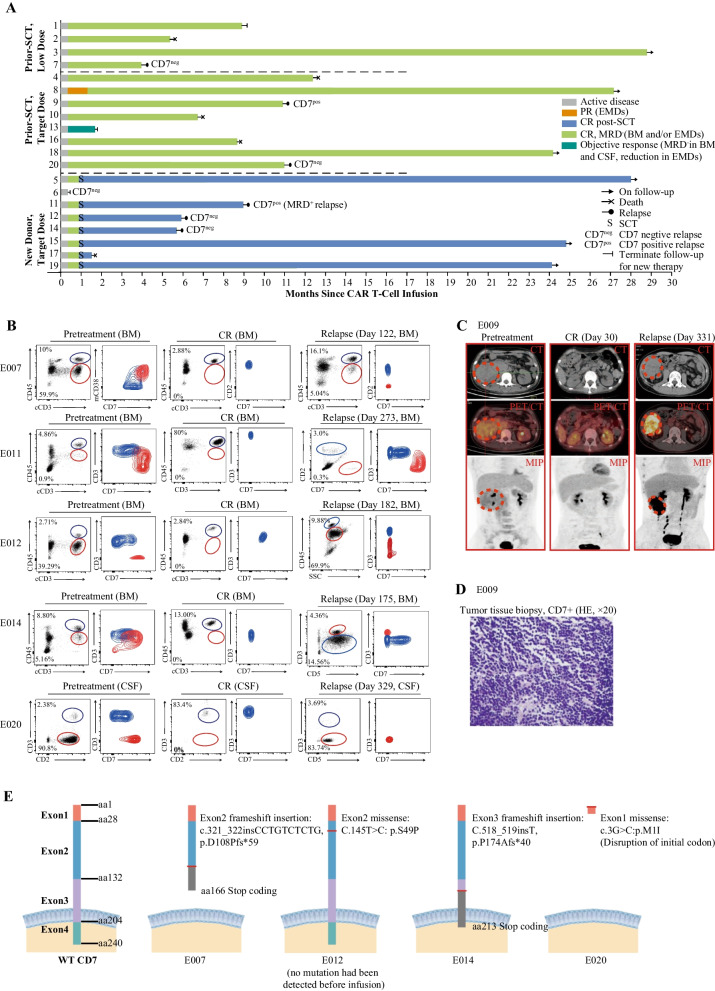
Fig. 2.
Clinical response and relapse. A Swimmer plot shows the clinical response and follow-up of individual patients treated with CD7 CAR T cells, as indicated with different colors in the swimmer lanes. Each bar represents one patient. Patients were listed in different subgroups separated by dotted lines. Patients who were no longer evaluable due to no response (NR) to therapy, loss to follow-up and receiving new therapies other than stem cell transplantation (SCT) are indicated; patients who received SCT still had their survival and relapse information recorded. B Flow cytometry plots show CD7 expression on blasts and normal T cells in the BM/CSF of five patients at enrollment, remission, and relapse; contour plots show CD7 expression on blasts (red) and normal T cells (blue) that were merged into the same plot. We had previously reported the flow cytometry plots of pretreatment, CR of all patients and relapse of patient E007. C Representative PET/CT of the patient E009 at enrollment, remission, and relapse in extramedullary lesions (enrollment and remission figures had been shown in our previous report). Patient E009 had a kidney lesion, and achieved complete remission at day 30 and relapsed at day 331 post CD7 CAR T cell infusion. D The hematoxylin–eosin and other HIC markers (CD1a−, CD3+, CD4+, CD7+, CD8−, CD33−, CD34−, CD99+) staining of a tissue specimen taken from the tumor tissue in perinephric region shows blasts of patient E009 CD7-positive relapse after CD7 CAR T cell infusion (original magnification × 20). E Schematic of the WT and mutated CD7 protein predicted based on next-generation sequencing of DNA extracted from the sample of four CD7-negative relapsed patients; exons and amino acids are numbered. The mutation of patient E007 had been reported previously. CAR—chimeric antigen receptor; CR—complete remission; PR—partial remission; EMDs— extramedullary diseases; MRD—minimal residual disease; BM—bone marrow; CSF—cerebrospinal fluid; CT—computed tomography; PET/CT—position-emission tomography; MIP—maximum intensity projection; HE—hematoxylin–eosin; aa—amino acid; WT—wild-type

