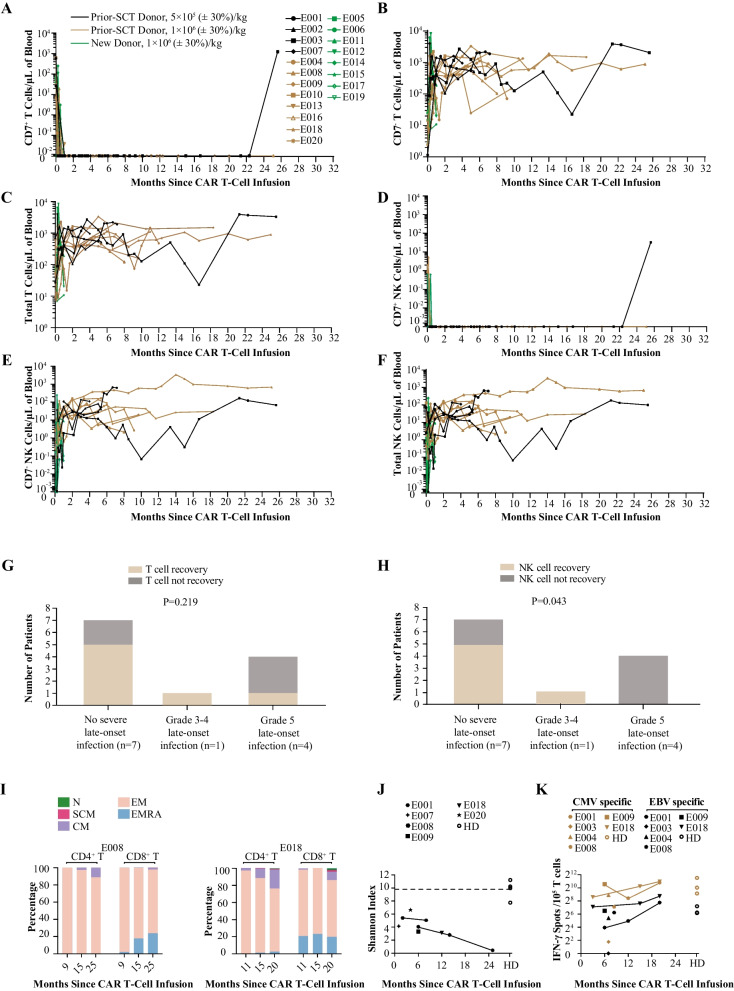
Fig. 5.
T-cell aplasia. A–F Kinetics of CD7+CD3+ T cells (A), CD7−CD3+ T cells (B), total CD3+ T cells (C), CD7+CD16+CD56+ NK cells (D), CD7−CD16+CD56+ NK cells (E), and total CD16+CD56+ NK cells (F) in peripheral blood of all treated patients, as measured by flow cytometry; CAR T and leukemia cells were excluded in this analysis; data were recorded until the cut-off date or the time point that discontinued follow-up; different types of symbols indicate different patients, and lines of different colors indicate different subgroups. G, H Association of T-cell recovery (G) or NK-cell recovery (H) with late-onset severe infection. The P value is based on Chi-square tests. I Percentage stacked bar charts show kinetics of subset compositions among CD3+CD4+ and CD3+CD8+ T cells in peripheral blood of two patients, as measured by flow cytometry. J T cell receptor sequencing data, presented as Shannon indexes from post-CD7 CAR T-cell therapy patients and healthy donors (some short-term results had been shown in our previous report, including E001 at month 2, E007 at month 1, E008 at month 6 and E009 at month 6); dashed line indicates median of normal values. K IFN-γ expressing T cells in PBMCs from post-CD7 CAR T-cell therapy patients and healthy donors after stimulation with CMV or EBV peptides (some short-term results had been shown in our previous reports, including E001 at month 8, E003 at month 7, E004 at month 7, E008 at month 6, E009 at month 6 and E018 at month 3), as determined by ELISPOT assay. CAR—chimeric antigen receptor; CMV—cytomegalovirus; EBV—Epstein-Barr virus; IFN—interferon; N—CD45RA+CD62L+CD95− naïve T cells; SCM—CD45RA+CD62L+CD95+ stem cell-like memory T cells; CM —CD45RA−CD62L+ central memory T cells; EM—CD45RA−CD62L− effector memory; EMRA—CD45RA+CD62L− effector memory cell re-expressing CD45RA; PBMC—peripheral blood mononuclear cells; HD—healthy donor

