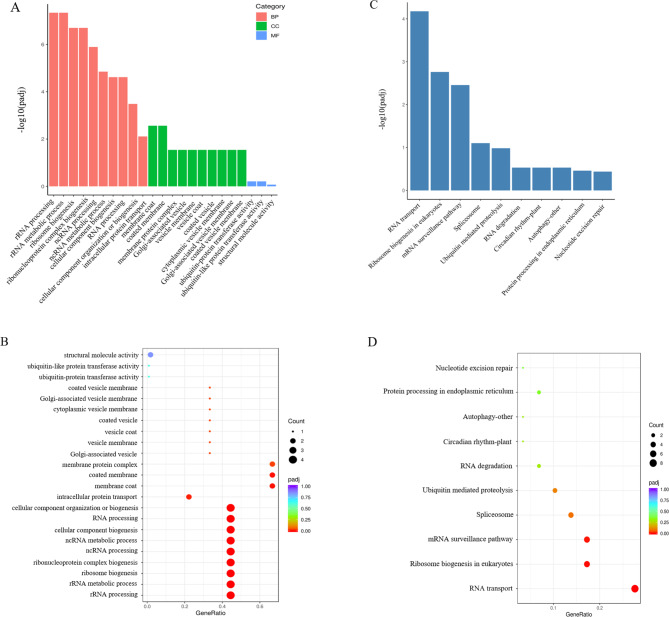
Fig. 4.
Go and KEGG enrichment analysis of 164 HvWD40 genes. A GO enrichment bar graph. The first 23 terms of the significance analysis were selected for display. The Y axis represents the p-value, and the X axis represents the GO term. BP biological process; CC cell composition, and MF molecular function. B GO enrichment bubble graph. The Y axis is the GO term, and the X axis is the enrichment factor. C KEGG enrichment bar graph. The first 10 pathways of the significance analysis were selected for display. The Y axis represents the p-value and the X axis represents the top 10 pathways [42–44]. D KEGG enrichment bubble graph. The Y axis is the enrichment pathway and the X axis is the enrichment factors. The bubble color represents the p-value, the redder the color is, the smaller the p-value is, the higher the enrichment degree is, and the size of the bubble indicates the quantity [42–44]

