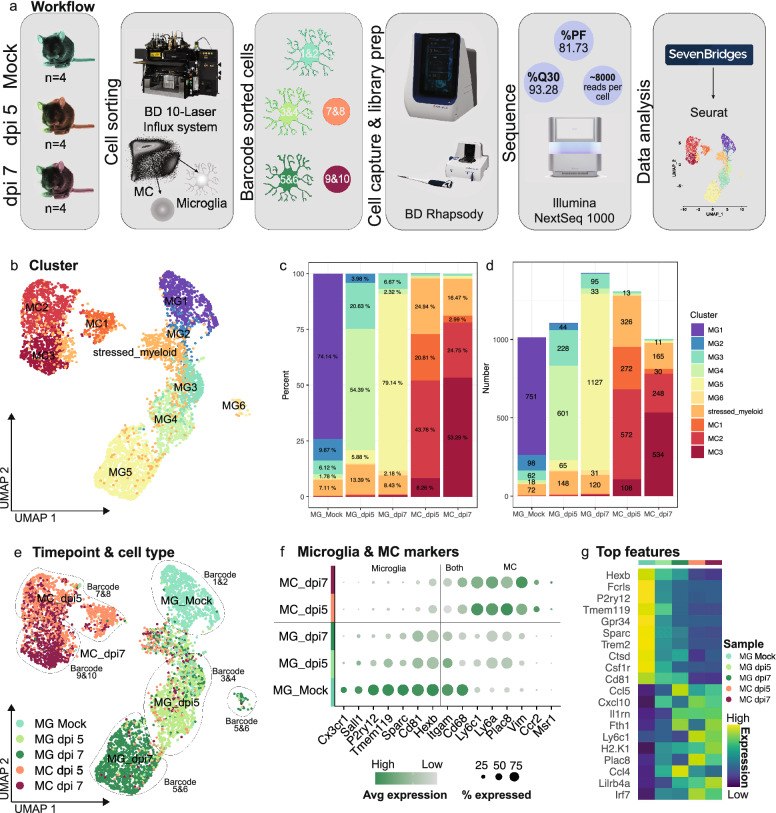
Fig. 1.
Single-cell RNA sequencing analysis on resident and infiltrating myeloid cells from the virus-infected CNS. a Schematic showing scRNA-seq pipeline. Microglia from mock-infected and microglia and MCs from WNV-infected brains at dpi 5 and 7 were flow cytometrically sorted, barcoded and pooled in equal numbers for cell capture on the BD Rhapsody. Libraries were sequenced on the Illumina NextSeq 1000 and processed in SevenBridges and Seurat. b UMAP plot showing 6 microglia and 3 MC clusters. c, d Percent (c) and number (d) of each microglia and MC cluster out of total microglia and MC populations in mock-infected and infected brains at dpi 5 and 7. e UMAP plot coloured by cell type and timepoint and overlaid with sample identifiers/barcode numbers. f Dot plot showing the expression of nominal microglia and MC genes in total microglia and MC populations in mock-infected and infected brains at dpi 5 and 7. g Heatmap showing the top differentially expressed genes in total microglia and MC populations in mock-infected and infected brains at dpi 5 and 7. Data is presented from one independent experiment with four mice per group

