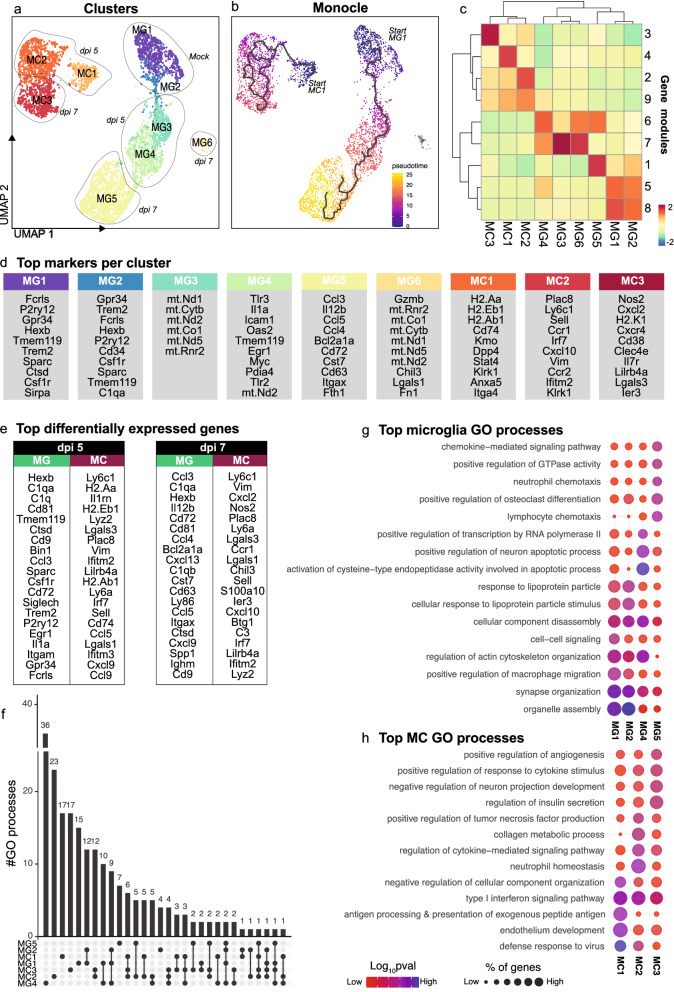
Fig. 2.
Microglia and MCs adopt unique timepoint-specific transcriptomes connected along a trajectory. a UMAP plot showing 6 microglia and 3 MC clusters. b UMAP plot coloured by pseudotime, determined using trajectory analysis with Monocle3. Increased pseudotime indicates further distance from starting cells (i.e., MG1 and MC1). c Clustered heatmap showing expression of gene modules in each microglia and MC cluster. d Top differentially-expressed genes per cluster. e Top differentially expressed microglia and MC genes at dpi 5 and 7. f UpSet plot showing overlap in the number of gene ontology (GO) biological processes enriched in microglia and MCs clusters. GO processes common to two or more clusters are denoted by a connecting line. g, h Dot plot showing the top 5 GO processes associated with each microglia (g) and MC (h) cluster. Data is presented from one independent experiment with four mice per group

