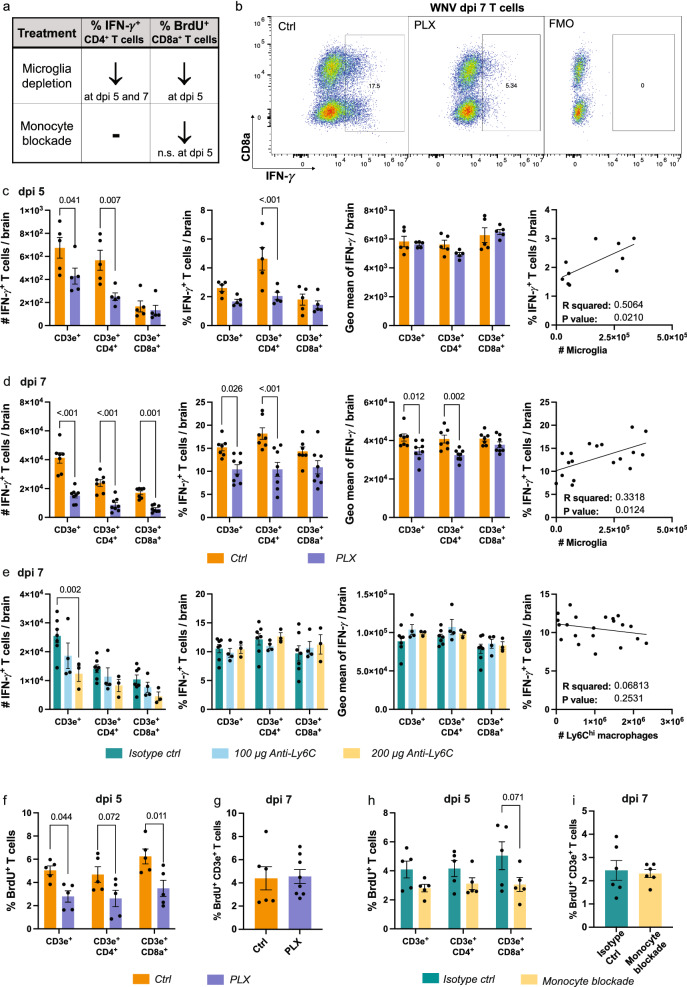
Fig. 5.
Microglia and MCs differentially promote CD4+ T cell IFN-γ production and CD8+ T cell proliferation. a Summary table showing changes in the frequency of IFN-γ+ and BrdU+ T cells with microglia and MC depletion in WNV-infected mice. b Flow cytometric dot plots showing the expression of IFN-γ in fully-stained samples and a fluorescence-minus-one (FMO, i.e., without anti-IFN-γ) in non-stimulated T cells from mice fed control (Ctrl) or PLX5622-formulated chow (PLX) until sacrifice at dpi 7. c, d Number and frequency IFN-γ-producing T cells, geometric mean of IFN-γ in T cells and correlation analysis between the number of microglia and frequency of IFN-γ-producing T cells from single-cell brain suspensions from Ctrl and PLX mice sacrificed at dpi 5 (c) or dpi 7 (d). e Number and frequency IFN-γ-producing T cells, geometric mean of IFN-γ in T cells and correlation analysis between the number of Ly6Chi MCs and frequency of IFN-γ-producing T cells from single-cell brain suspensions from anti-Ly6C-treated mice sacrificed at dpi 7 (e). f–i Frequency of BrdU+ proliferating T cells in WNV-infected mice treated with PLX5622 and culled at dpi 5 (f) or 7 (g) or in WNV-infected mice treated with monoclonal antibodies to block monocyte infiltration and culled at dpi 5 (h) or 7 (i). Data is presented as mean ± SEM from one or two independent experiments with 3–8 mice per group

