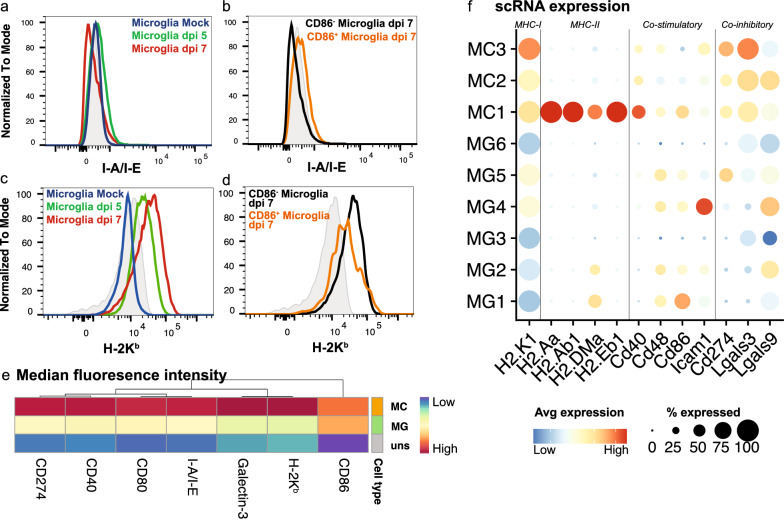
Fig. 6.
MCs express T cell co-stimulatory and co-inhibitory markers more highly than microglia in lethal CNS infection. a-d Histograms showing the expression of I-A/I-E (MHC-II) (a, b) and H-2 Kb (MHC-I) (c, d) on total microglia in mock-infected and infected brains at dpi 5 and 7 (a, c) and on CD86+ and CD86− microglia at dpi 7 (b, d). e Heatmap showing the geometric mean of MHC molecules and T cell co-stimulatory and co-inhibitory markers on total MC and microglia populations at dpi 7. Hierarchical clustering was performed on both rows and columns. f Dot plot showing the expression of MHC and T cell co-stimulatory and co-inhibitory genes in microglia and MC clusters from scRNA-seq data

