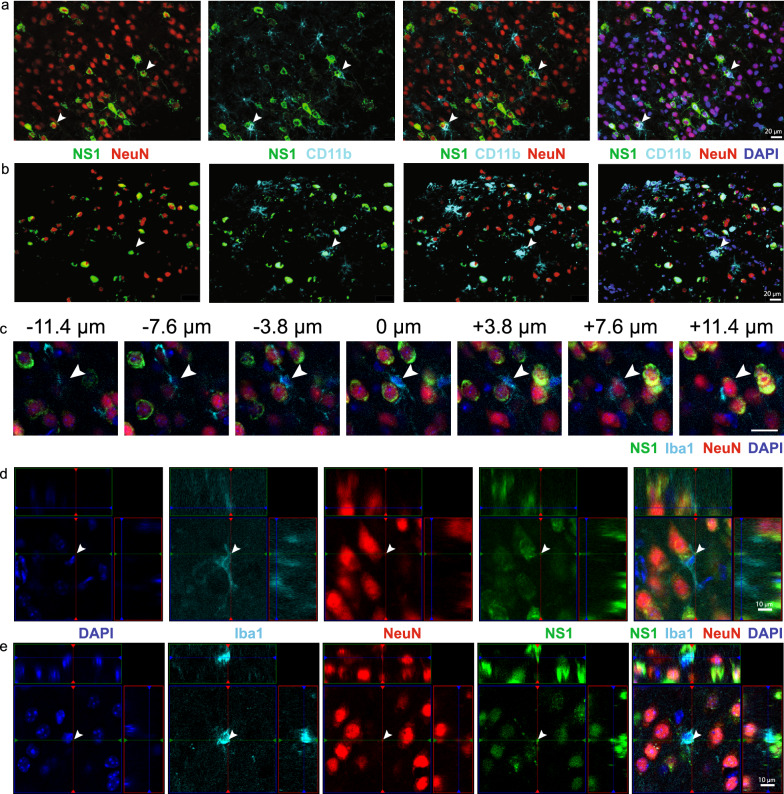
Fig. 8.
Microglia phagocytose WNV-infected neurons. a, b Expression of NS1 (green), NeuN (red), CD11b (cyan) and DAPI (blue) in two fields of view in brains sections from WNV-infected mice at dpi 7. Arrowheads show CD11b+ ramified processes (microglia) around WNV-infected neurons. c–e Confocal imaging of thick tissue sections stained with DAPI (blue), Iba1 (cyan), NeuN (red) and NS1 (green). c Image series through the z direction centred at the nucleus of the microglia (arrowhead) displaying processes wrapping around the soma. d–e Colocalisation of foci (arrowhead) of NeuN and NS1 inside a microglia, indicating microglia phagocytosis of an infected neuron. Scale bar represents 10 μm (d, e) or 20 μm (a–c)

