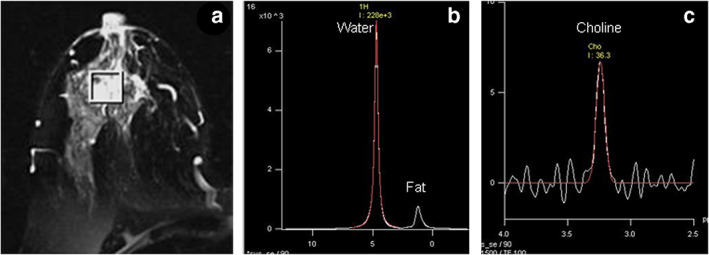
FIGURE 7.

(a) T2 weighted MR image of a patient suffering from locally advanced breast cancer while (b) shows the in vivo 1H MR spectrum acquired without water and fat suppression from the VOI shown in (a). (c) MR spectrum obtained from the same voxel with water + fat suppression. VOI, volume of interest. Reprinted under a Creative Commons (CC BY 4.0) license from: Sharma U, Jagannathan NR. In vivo MR spectroscopy for breast cancer diagnosis. BJR Open. 2019;1(1):20180040. doi: 10.1259/bjro.20180040. PMID: 33178927; PMCID: PMC7592438.
