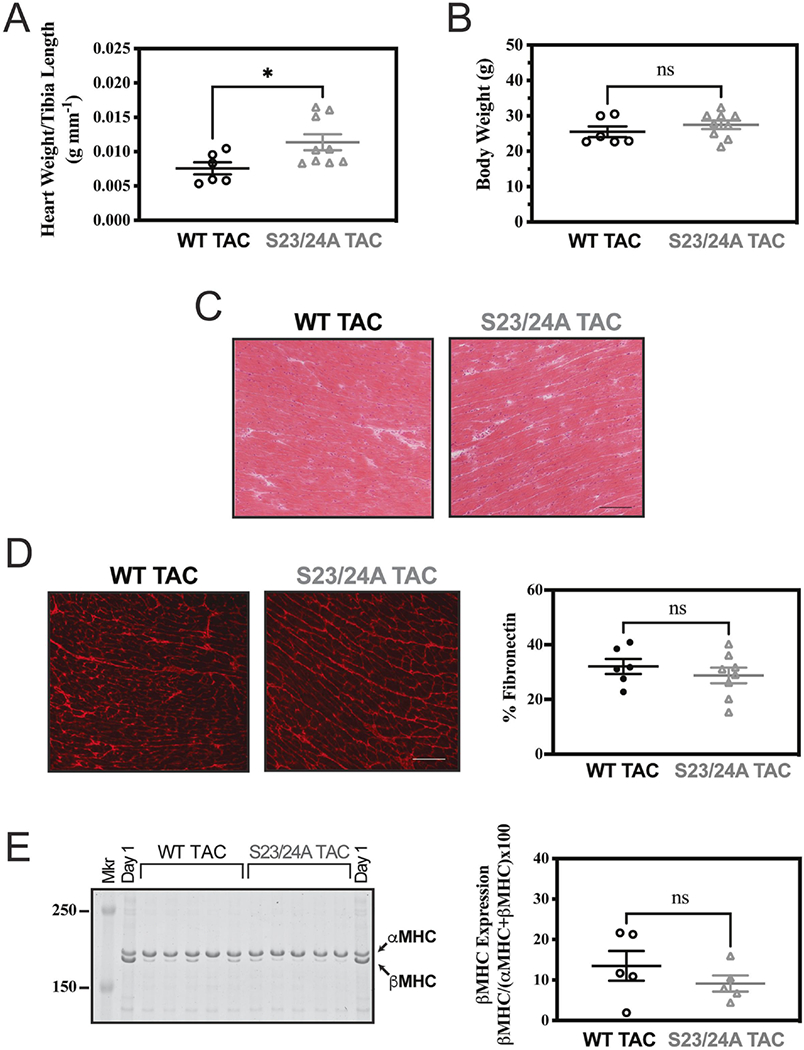
Figure 4. Morphology of WT and TnI S23/24A mice following TAC.

Excised heart cardiac morphology of WT TAC (black circle) and S23/24A TAC (grey triangle) mice at 12 weeks after TAC for (A) heart weight and (B) body weight. n = 6 mice for WT TAC and n = 9 mice for S23/24A TAC. (C) Representative hematoxylin and eosin stained ventricle sections (Bar = 100 um). (D) Representative fibronectin stained ventricle sections (Bar = 100 um) and fibronectin quantification. n = 6 mice for WT TAC and n = 8 mice for S23/24A TAC. (E) Coomassie stained gel of mouse ventricle homogenate and beta myosin heavy chain quantification. αMHC, alpha myosin heavy chain; βMHC, beta myosin heavy chain; Mkr, Molecular Weight Marker; Day 1, 1 day old mouse heart expressing both αMHC and βMHC. n = 5 hearts for WT TAC and n = 5 hearts for S23/24A TAC. ns, P>0.05; *P<0.05, WT TAC versus S23/24A TAC by unpaired t test. Error bars are standard error of the mean.
