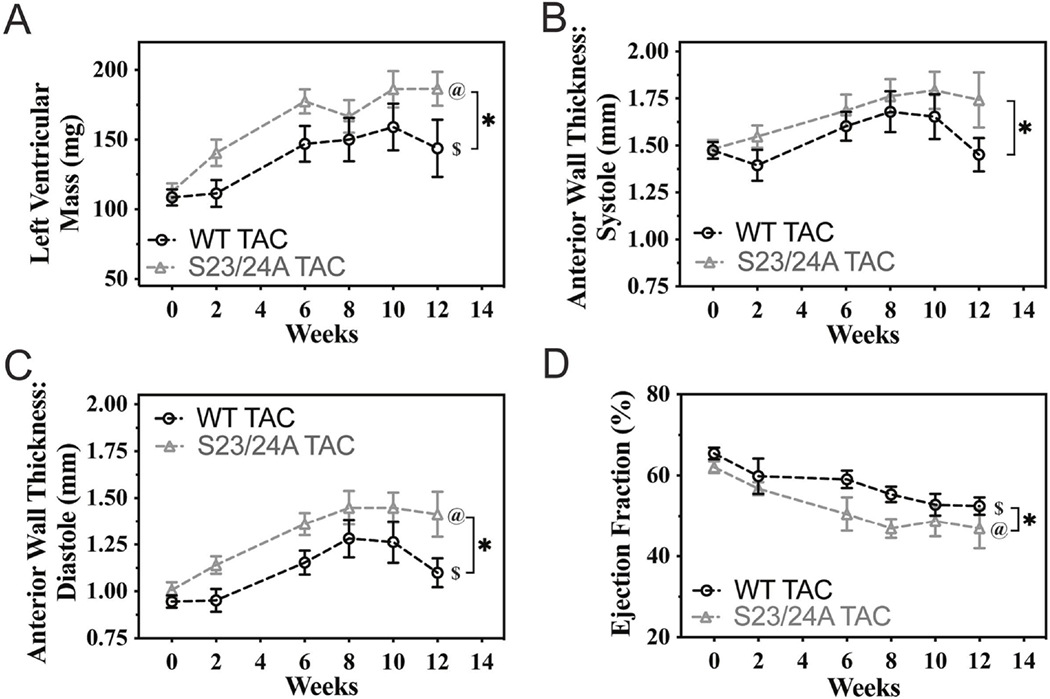
Figure 5. Cardiac structure and derived function of WT and TnI S23/24A mice following TAC.

Echocardiography measurement of WT TAC (black circle) and S23/24A TAC (grey triangle) mice before and at 2, 6, 8, 10 and 12 weeks after TAC for (A) left ventricular mass, (B) left ventricular anterior wall thickness at systole, (C) left ventricular anterior wall thickness at diastole and (D) ejection fraction. n = 6-12 mice per week for WT TAC and n = 9-13 mice per week S23/24A TAC. $P<0.05, WT TAC versus time; @P<0.05, S23/24A TAC versus time by one-way analysis of variance. *P<0.05, WT TAC versus S23/24A TAC by two-way analysis of variance. Error bars are standard error of the mean.
