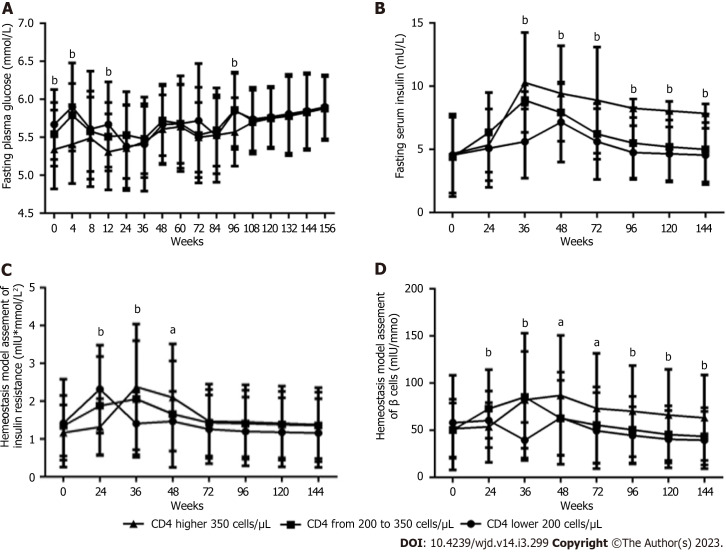
Figure 5.
Long-term effects of baseline CD4+ T-cell count on glucose metabolism parameters within 156 wk after antiretroviral therapy with tenofovir plus lamivudine plus efavirenz in male patients living with human immunodeficiency virus (n = 61; 26, 12, and 23 patients in the < 200, 200 to 350, and > 350 groups, respectively). A: Fasting plasma glucose level; B: Fasting serum insulin level; C: Homeostasis model assessment of insulin resistance value; D: Homeostasis model assessment of β-cell function value. Two-way ANOVA was used to compare glucose metabolism parameters among the three groups from baseline to 156 wk (interaction, A, P < 0.01; B, C, D, all P < 0.0001. Row factor, A, B, C, D, all P < 0.0001. Column factor, A, B, D, all P < 0.0001; B, P < 0.05). One-way ANOVA was used to compare glucose metabolism parameters among the three groups at the same time point, aP < 0.05, bP < 0.01.

