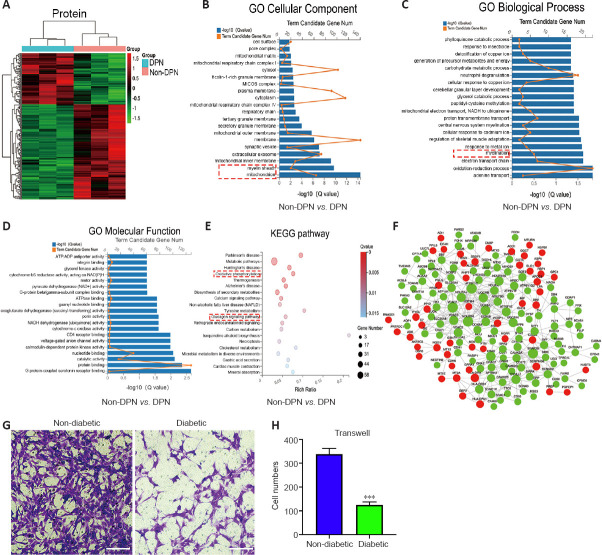
Figure 2.
Protein profiling analysis and the detection of SC function in DPN.
(A) Hierarchical clustering analyses of differentially expressed proteins in the non-DPN vs. DPN group (n = 3). (B) GO cellular component analysis of differentially expressed proteins. The red dotted box highlights the cellular components of interest. (C) GO biological process analysis of differentially expressed proteins. The red dotted box highlights the biological processes of interest. (D) GO molecular function analysis of differentially expressed proteins. (E) KEGG pathway analysis of differentially expressed proteins. The red dotted box highlights the pathways of interest. (F) The PPI network based on the STRING database showed the interactions between differentially expressed proteins. The green and red nodes represent proteins with decreased and increased expression, respectively. (G, H) Transwell assays indicated that the migrating number of SCs in the diabetic group was lower compared with that in the non-diabetic group. Scale bars: 100 μm. All bar graphs represent the average of three independent replicates, and the error bars are the SD. ***P < 0.001, vs. non-diabetic (independent-sample t-test). DPN: Diabetic peripheral neuropathy; GO: Gene Ontology; KEGG: Kyoto Encyclopedia of Genes and Genomes; PPI: protein-protein interaction.

