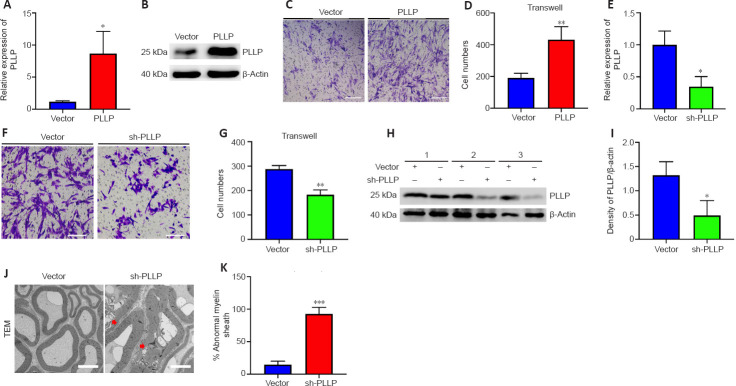
Figure 6.
PLLP regulates SC migration and myelination.
(A, B) RT-PCR and western blotting showed that PLLP expression was increased in the SCs transfected with LV-PLLP. Y-axis: fold changes in mRNA expression compared with the vector group. *P < 0.05, vs. vector group (independent-sample t-test). (C, D) Transwell assays revealed that the number of migrating SCs in the PLLP group was greater than that in the vector group. **P < 0.01, vs. vector group (independent-sample t-test). Scale bars: 100 μm. (E) RT-PCR analysis showed that the mRNA expression of PLLP was decreased in PLLP knockdown SCs. Y-axis: fold changes in mRNA expression compared with the vector group. *P < 0.05, vs. vector group (independent-sample t-test). (F, G) The number of migrating SCs in the sh-PLLP group was low compared with that in the vector group in the Transwell assays. **P < 0.01, vs. vector group (independent-sample t-test). Scale bars: 100 μm. (H) Eight weeks after the injection of LV-vector or LV-sh-PLLP, PLLP expression was examined via western blotting (n = 3). (I) Quantification of PLLP by the densitometry of protein bands. *P < 0.05, vs. vector group (paired t-test). (J) The number of abnormal myelin sheaths in the sh-PLLP group, measured via transmission electron microscopy, was higher than that in the vector group (n = 4). Arrows point to abnormal myelin sheaths. Scale bars: 5 μm. (K) Quantification of the ratio of myelin abnormalities in J. The data are given as the mean ± SD. **P < 0.01, vs. vector group (paired t-test). LV: Lentivirus; PLLP: plasmolipin; sh-PLLP: short hairpin RNA for PLLP; TEM: transmission electron microscope.

