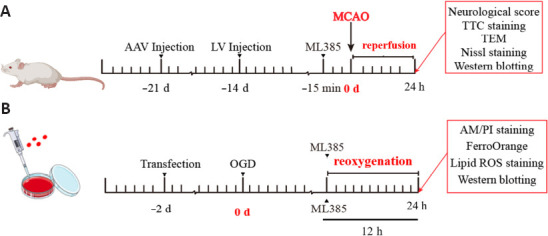
Figure 1.

Diagram of the experimental time frame.
(A, B) Time course of interventions in the in vivo (A) and in vitro (B) studies. AAV: Adeno-associated virus; AM/PI: Calcein-AM/PI; LV: lentiviral vector; MCAO: middle cerebral artery occlusion; ML385: inhibitor of Nrf2; OGD: oxygen-glucose deprivation and reoxygenation; ROS: reactive oxygen species; TEM: transmission electron microscope; TTC: 2,3,5-triphenyl-2H-tetrazolium chloride.
