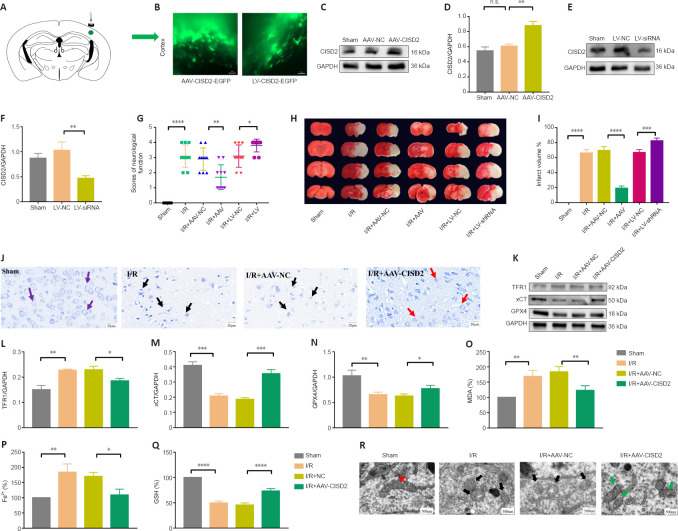
Figure 3.
Overexpression of CISD2 alleviates I/R injury and inhibits ferroptosis.
(A, B) AAV and LV were injected into the cerebral tissue via stereotaxic injection. Scale bars: 50 µm. (C–F) Representative western blots and quantitative evaluations of the effect on CISD2 overexpression and knockdown in the cerebral tissue of CIRI mice. (G) Neurological dysfunction scores (Longa Score Scale). Higher scores indicate more severe neurological deficits. The effect of CISD2 overexpression and knockdown on neurological dysfunction scores in CIRI mice. (H, I) The effect of CISD2 overexpression and knockdown on the volume of cerebral infarction in CIRI mice was evaluated via TTC staining. Compared with the I/R + AAV-NC group, the infarct volume in the I/R + AAV group was significantly reduced. Compared with the I/R + LV-NC group, the infarct volume of the I/R + LV group was significantly increased. The white area represents the infarct area, and the red area represents the normal area. (J) The effects of CISD2 overexpression on neuronal morphology following injury in mice were detected via Nissl staining. Compared with the Sham group, the cells in the I/R group had fewer Nissl bodies (arrows) in the cytoplasm. The number of Nissl bodies in the I/R + AAV-CISD2 group was significantly reduced compared with that in the I/R + AAV-NC group. Scale bars: 20 µm. (K–N) Representative western blots and quantitative evaluations of CISD2 overexpression in terms of TFR1, xCT, and GPX4 expression in cerebral tissue. (O–Q) The effect of CISD2 overexpression on MDA, Fe2+, and GSH in the cerebral tissue of CIRI mice. The data were normalized to those from the control group. Data are represented as the mean ± SEM (n = 3–10). *P < 0.05, **P < 0.01, ***P < 0.001, ****P < 0.0001 (one-way analysis of variance followed by Tukey’s post hoc test). (R) The effect of CISD2 overexpression on mitochondrial morphology in cerebral tissue following CIRI in mice, evaluated via TEM. In the I/R group, the mitochondria were shrunken and the crest structures had disappeared. However, when CISD2 was overexpressed, the degree of injury in the mitochondrial morphology was significantly lower. Scale bars: 500 nm. AAV: Adeno-associated virus vector; CIRI: cerebral ischemia/reperfusion injury; CISD2: CDGSH iron sulfur domain 2; GAPDH: glyceraldehyde-3-phosphate dehydrogenase; GPX4: glutathione peroxidase 4; GSH: glutathione; I/R: cerebral ischemia/reperfusion; MDA: malondialdehyde; LV: lentiviral vector; NC: negative control; Sham: sham-operated group; TEM: transmission electron microscope; TFR1: transferrin receptor 1; TTC: 2,3,5-triphenyl-2H-tetrazolium chloride; xCT: a cystine/glutamate antiporter.

