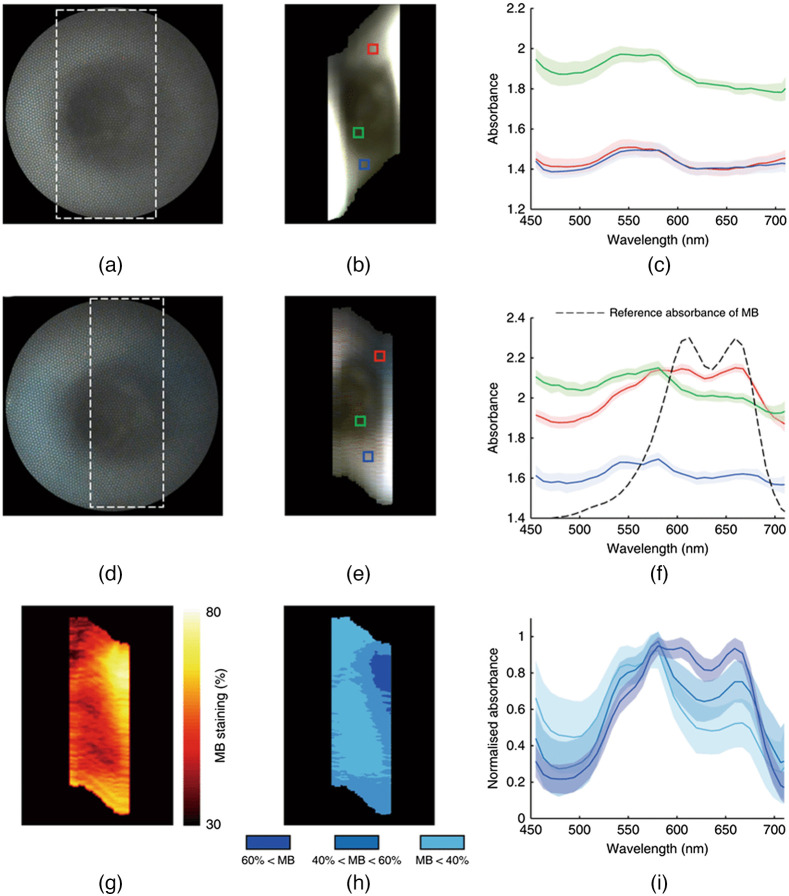
Fig. 15.
Images taken from an ex vivo pig esophagus by a compact spectral endoscope. (a)–(c) The esophagus taken before staining. (d)–(f) The esophagus after MB staining. (g) and (h) The estimation map of MB concentration using two different linear unmixing methods. (i) The spectral absorbance plot for the shaded areas in (h). In (c) and (f), the color corresponds to the color segment in the corresponding image to the left (reproduced from Ref. 231).

