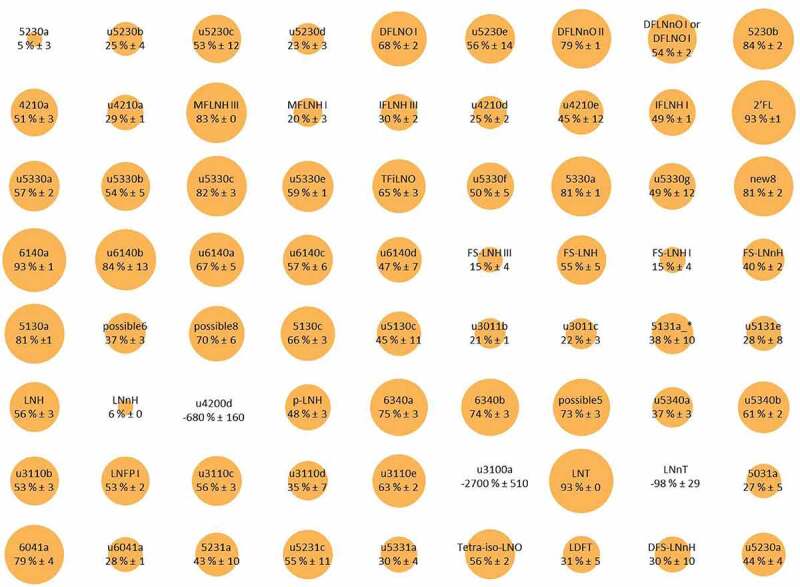
Figure 1.

Bubble plot representation of simultaneous glycoprofiling of 78 different HMO structures differentially consumed by BL. infantis. The size of the bubble depicts the percent consumption of that specific HMO. Reproduced with permission from Strum et al.42 Copyright (2012) American Chemical Society.
