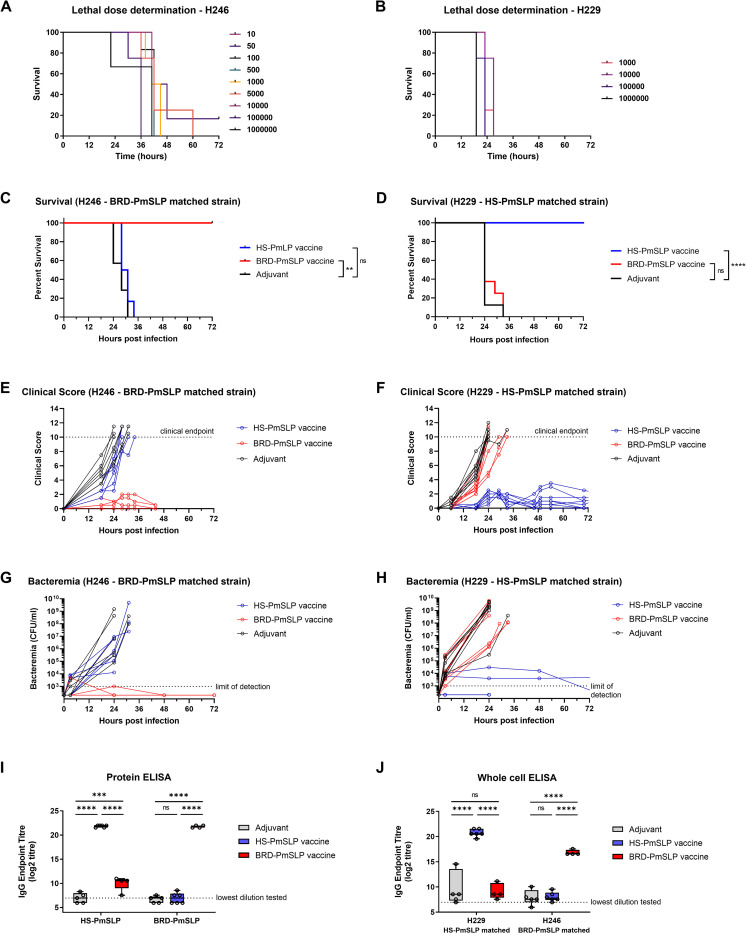
Fig 2. Evaluation of PmSLP vaccines using a mouse sepsis model.
A. Determination of the lethal dose for a PmSLP group 1 (H246) and B. a group 3 (H229) isolate. N = 3–6 mice per group (3 mice per group for infectious dose of 106 CFU; 4 mice per group use for infectious doses between 500 CFU to 105 CFU; 6 mice per group for doses lower than 500 CFU). C. Survival of vaccinated and control animals after challenge with the BRD-PmSLP antigen-matched strain H246. N = 4 BRD-PmSLP, N = 6 HS-PmSLP, N = 7 Adjuvant). D. Survival of vaccinated and control animals after challenge with the HS-PmSLP antigen-matched strain H229. N = 8 per group. Log-rank (Mantel Cox) tests performed for survival curve comparisons; ****, p<0.0001; **, p<0.01; ns, not significant. E,F. Cumulative clinical scores depicted for individual animals over the course of 72 hours. Dotted lines at 10 indicate the clinical cut-off used for determining humane endpoint. G,H. Bacterial burden in tail bleeds depicted for individual animals over the duration of the challenge trial. I. Serum IgG titre in vaccinated or adjuvant control animals measured using purified BRD-PmSLP or HS-PmSLP proteins as capture. J. Serum IgG titre in vaccinated or adjuvant control animals measured using heat inactivated whole bacteria as capture. For I and J, boxplot with individual animals is shown. 2-way ANOVA with Tukey’s multiple comparisons test performed on log2 transformed data to calculate p-value. ***, p<0.005; ****, p<0.0001; ns, not significant.

