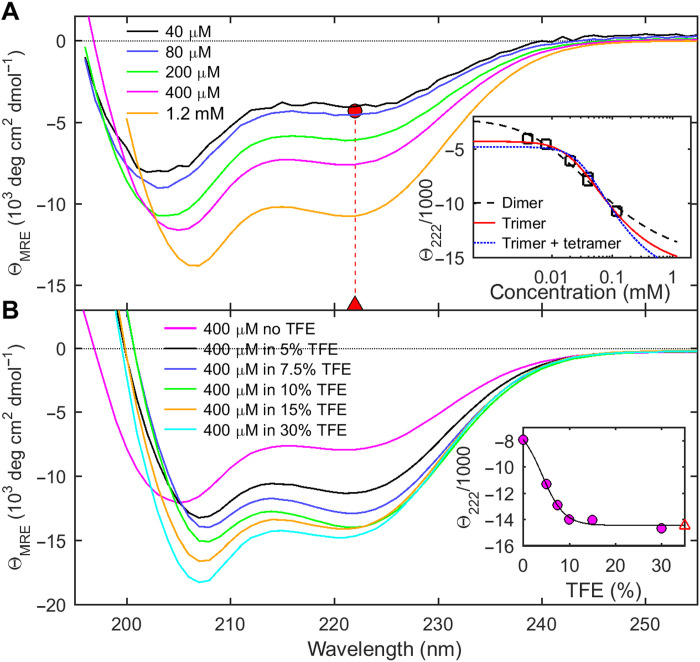
Fig. 3. Concentration-dependent helix formation of NLRS.
Shown are CD spectra in units of MRE values θMRE, which directly reflect molecular peptide helicity. (A) Dependence of ellipticity on NLRS concentrations. The inset shows the best fit of θ(222 nm), jointly with the sw isotherm of Fig. 2A, with the GMMA model indicated. The GMMA monomer-trimer model results in best-fit helicities of −4290 and −16,210 deg cm2 dmol−1 for the monomer (red circle) and trimer (red triangle) state, respectively, corresponding to ≈3 helical residues in the NLRS monomer increasing to ≈16 helical NLRS residues per peptide in the trimer. (B) Solvent-induced change in helicity of 0.4 mM NLRS at different concentrations of TFE. The inset shows θ(222 nm) (circles) and the best-fit two-state model (line) resulting in the best-fit ellipticity of the maximally helical state of −14,400 deg cm2 dmol−1 (red open triangle), corresponding to estimated ≈14 helical NLRS residues per peptide chain.

