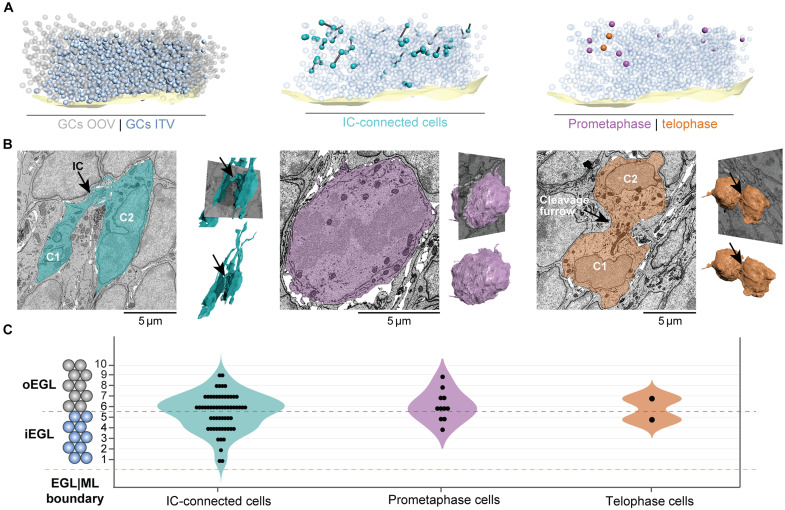
Fig. 2. Characterization of GCs in the ssSEM volume.
(A) Left: 3D map of EGL/ML boundary (light yellow) and 2042 GCs in the EGL of the volume: 1110 partially outside of the volume (OOV; gray) and 932 inside the volume (ITV; blue); middle: 3D map of IC-connected GCs (cells, cyan; ICs, black cylinders); right: 11 GCs in prometaphase (purple) and 2 in telophase (orange) distributed ITV. (B) 2D cross sections along the sagittal plane of the EGL and 3D reconstructions of GCs in different cell cycle stages. Left: IC-connected GCs (black arrow) with well-formed nuclei and long protrusions; middle: GC in prometaphase exhibiting a broken nuclear envelope and a round shape without protrusions; right: GCs in telophase showing fully formed nuclei, without protrusions, and connected by a cleavage furrow (black arrow). (C) Distribution of GCs interconnected by ICs (n = 60), prometaphase (n = 11), and telophase (n = 2) throughout the EGL shows that all events take place in the inner (layers 1 to 5) and outer (layers 6 to 10) EGL.

