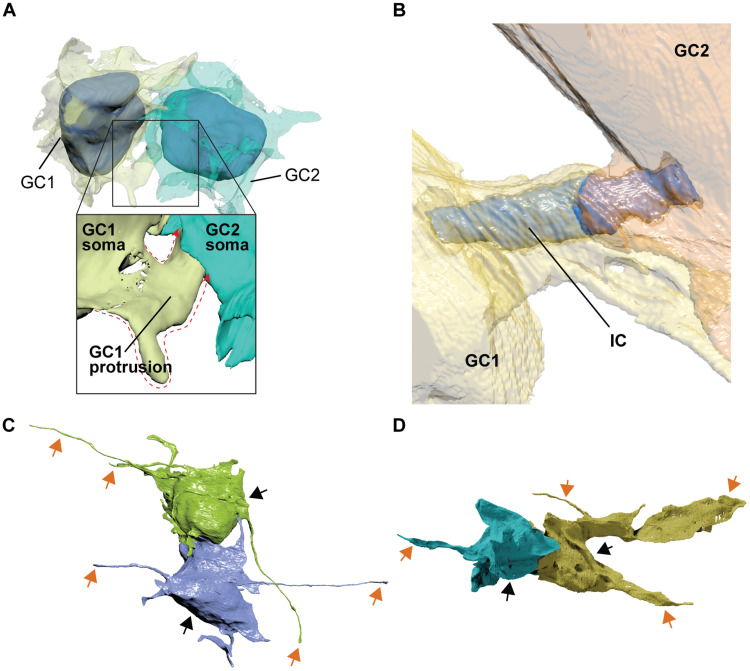
Fig. 3. Morphological assessment of IC-connected GCs reveals distinct cellular features.
(A) 3D reconstruction showing an example of IC-connected GCs via a cell protrusion (protrusion contour depicted by red dotted line): GC1 and GC2 connected via IC originating from protrusion of GC1. (B) 3D reconstruction showing sheets wrapped around IC (blue) extending from both connected cells (GC1, yellow; GC2, orange). (C and D) 3D reconstruction of IC-connected GCs (cell somas, black arrows) extending filopodia and lamellipodia (orange arrows).

