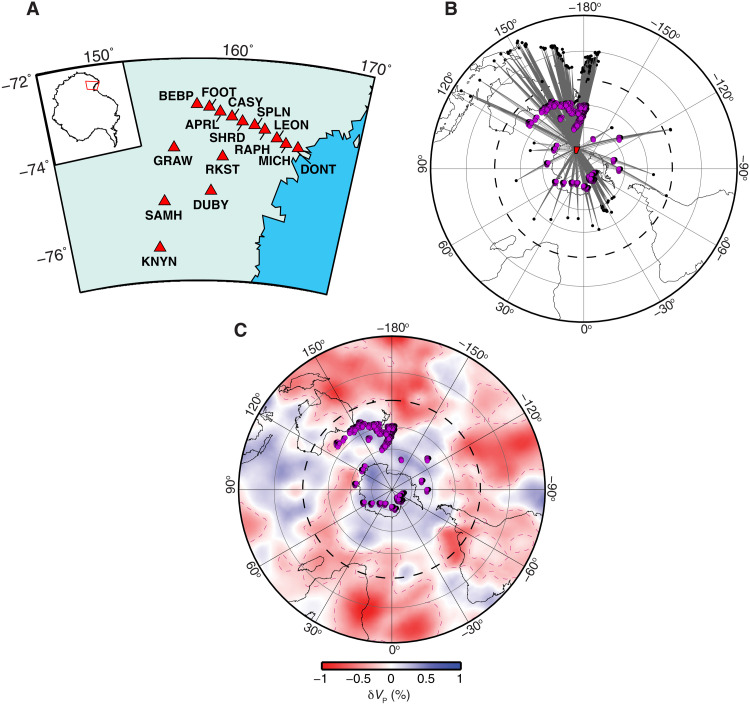
Fig. 2. Stations and events.
(A) TAMNNET stations (red triangles) with corresponding station names. The location of this map in relation to the rest of Antarctica is shown by the red polygon on the inset (upper left). (B) The 227 events (black dots) recorded by the TAMNNET stations (red polygon) used to investigate ULVZ structure beneath the Southern Hemisphere. Gray lines denote the PcP source-receiver ray paths, and purple dots denote the PcP CMB reflection (bounce) points. (C) Same PcP bounce points shown in (B) overlain on the P-wave tomography (δVP) model from Hosseini et al. (62) at a depth of 2800 km.

