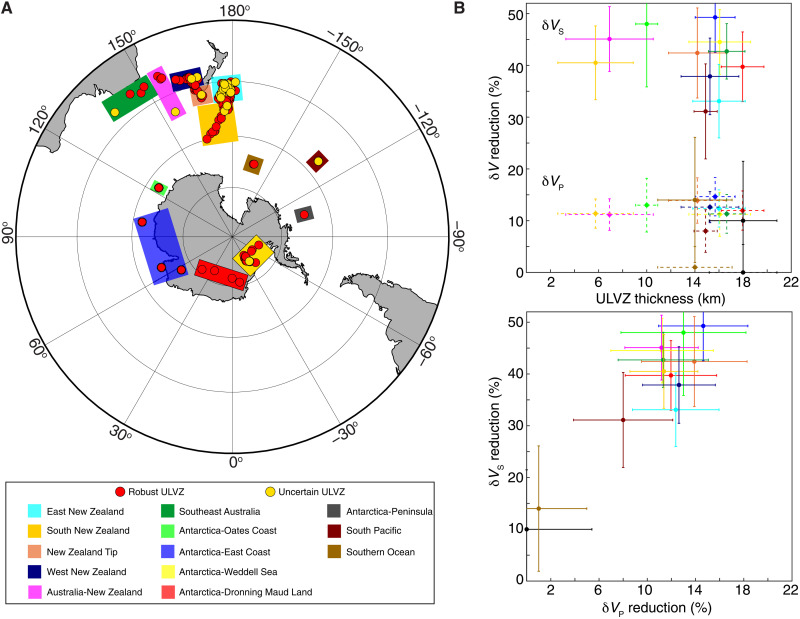
Fig. 4. ULVZ results beneath the Southern Hemisphere.
(A) Average PcP CMB bounce points for examined events. Red dots indicate events that meet all three modeling criteria and show robust ULVZ evidence, and yellow dots denote events that fell below the CQ improvement over PREM threshold and hence provide uncertain ULVZ evidence. Colored rectangles denote geographic families. (B) ULVZ parameters averaged by geographic family with corresponding SDs. Top: Measurements with solid error bars correspond to δVS, and those with dashed error bars correspond to δVP. Colors are the same as in (A).

