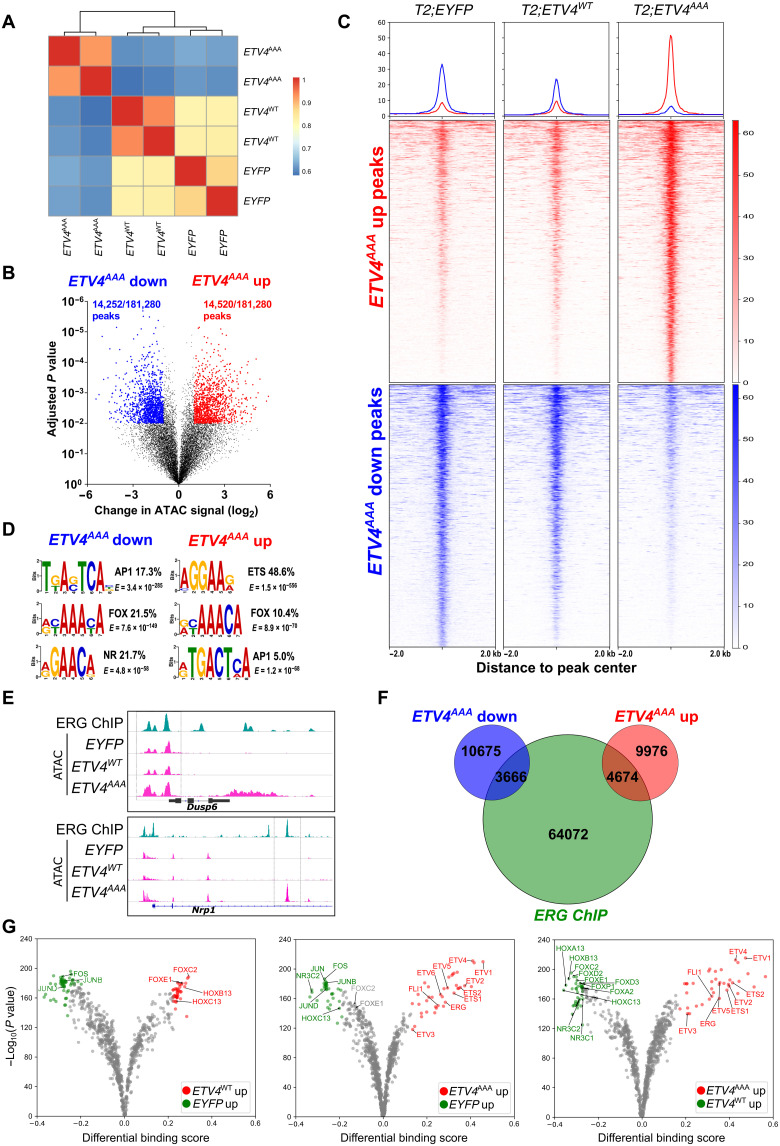
Fig. 2. ETV4AAA induces widespread changes in chromatin landscape.
(A) Clustering of ATAC signal intensity at mapped peaks of EYFP-, ETV4WT-, and ETV4AAA-expressing cells. (B) Volcano plot of ATAC peaks, with significantly increased and decreased peak of ETV4AAA-expressing cells compared with EYFP-expressing cells show [adjusted P < 0.01, fold change (FC) > 2]. (C) Peaks with increased and decreased signal of ETV4AAA-expressing cells compared with that of EYFP-expressing cells are shown with heatmap. (D) The enriched motifs of ETV4AAA–up-regulated or ETV4AAA–down-regulated ATAC peaks are shown. (E) The chromatin accessibility of well-characterized ETS targets, Dusp6 and Nrp1 from ERG chip-seq data of Pb-Cre4; Rosa26ERG/ERG mice and ATAC-seq data of EYFP-, ETV4WT-, and ETV4AAA-expressing cells are shown. (F) Venn plot shows the overlap between ERG-binding sites from ERG ChIP-seq and significantly increased and decreased ATAC peaks of ETV4AAA-expressing cells compared with that of EYFP-expressing cells. (G) Volcano plot of footprinting motif analysis on ATAC-seq data shows the increased binding of transcription factors of EYFP-, ETV4WT-, and ETV4AAA-expressing cells.

