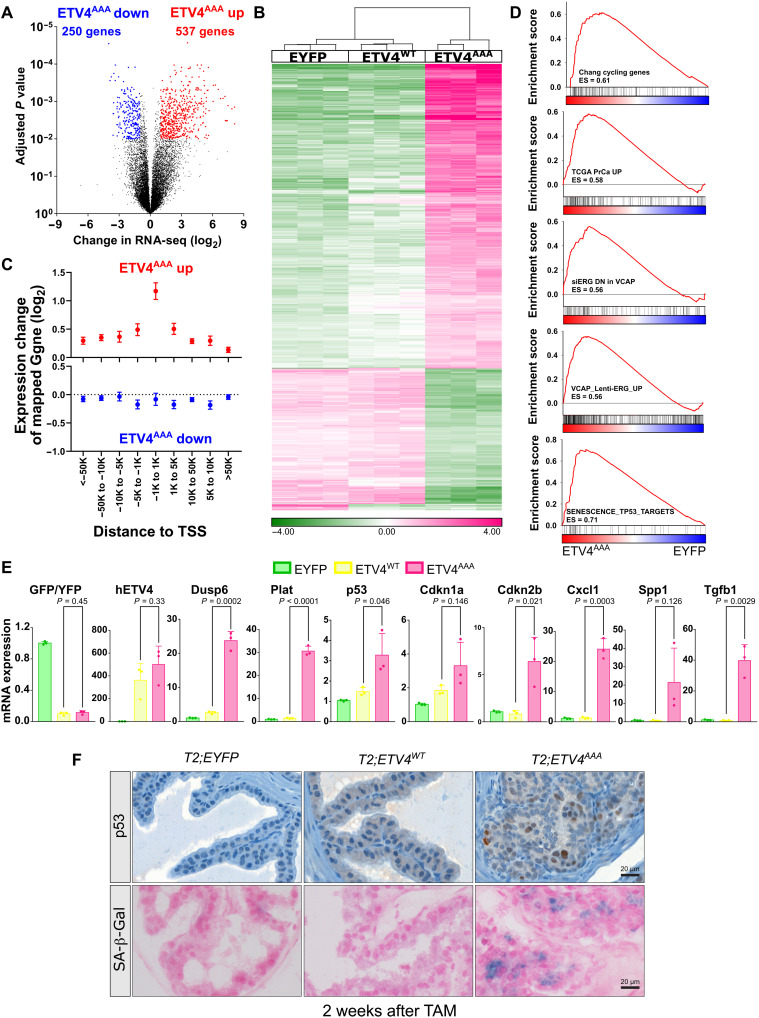
Fig. 3. ETV4AAA induces p53 and senescence.
(A) Volcano plot of up-regulated genes and down-regulated genes in ETV4AAA-expressing cells compared with that in EYFP-expressing cells by RNA-seq. (B) Hierarchical clustering of genes significantly changed by ETV4AAA-expressing cells compared that by with EYFP- and ETV4WT-expressing cells. (C) The expression of genes mapped to increased (upper panel) or decreased peaks (lower panel) in ETV4AAA-expressing cells compared with that in EYFP-expressing cells is shown by integrative analysis of ATAC-seq and RNA-seq data. (D) The enriched gene sets in ETV4AAA-expressing cells compared with that in EYFP-expressing cells are analyzed using gene set enrichment analysis. (E) The expression of individual genes in EYFP, ETV4WT and ETV4AAA prostate cells are shown using RNA-seq data. n = 3 for each phenotype. (F) The expression of p53 in anterior prostate of EYFP, ETV4WT, and ETV4AAA mice 2 weeks after TAM treatment is analyzed with IHC staining. The senescence-associated β-galactosidase (SA-β-Gal) is analyzed with SA-β-Gal staining. Scale bars, 20 μm. Error bars are SD.

