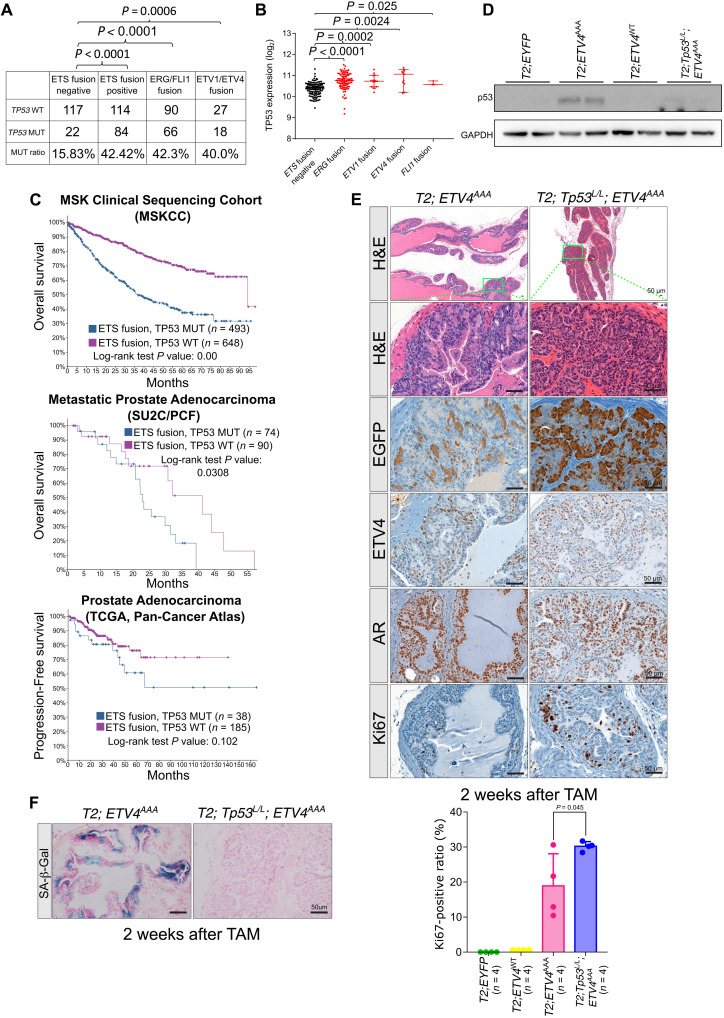
Fig. 4. P53 loss reduces ETV4AAA induces senescence.
(A) TP53 alteration rate (mutation or copy number loss) in ETS fusion–positive samples and ETS fusion–negative samples from TCGA data of primary prostate cancer is quantified. (B) TP53 mRNA expression levels are analyzed in ETS fusion–positive samples compared with that in ETS fusion–negative samples among TP53 wild-type samples from TCGA data of primary prostate cancer. (C) The survival probability of patients with TP53 loss in ETS-positive prostate cancer. (D) The expression of p53 in EYFP, ETV4WT, ETV4AAA, and ETV4AAA;Tp53L/L mice 2 weeks after TAM treatment are analyzed with Western blot. (E) Representative H&E (low magnification and high magnification of indicated area) and IHC of EGFP (antibody recognizes both EGFP and EYFP), AR, ETV4, and Ki67 of anterior prostate 2 weeks after TAM treatment in T2; Tp53L/L; ETV4AAA mice. The Ki67-positive luminal cell ratios are quantified on IHC stained slides. (F) Representative SA-β-Gal staining of anterior prostate 2 weeks after TAM treatment in T2; ETV4AAA and T2; Tp53L/L; ETV4AAA mice. Error bars are SD.

