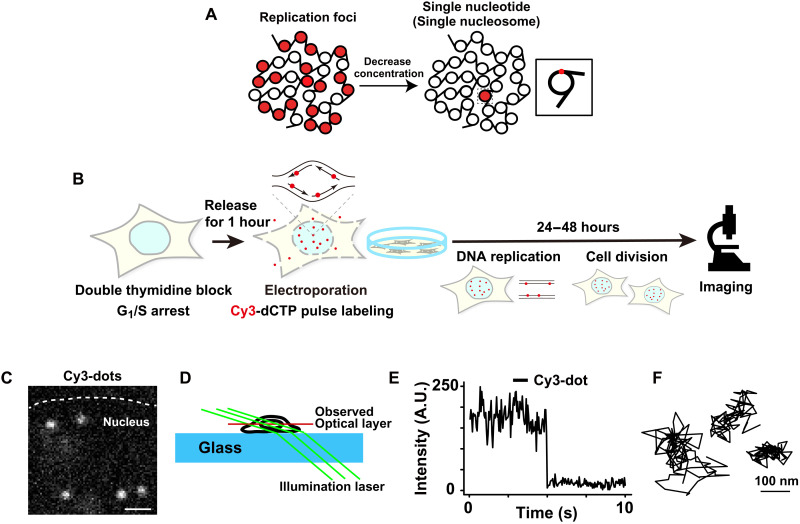
Fig. 2. Imaging single-nucleosomes labeled with fluorescent nucleotides in living cells.
(A) Schematic of replication foci labeling with fluorescent nucleotides at high concentrations (left) and single-nucleosome labeling with a low concentration of fluorescent nucleotides (right). The inset shows that single-nucleosome labeling is based on the incorporation of a single nucleotide conjugated with fluorescent dye. This cartoon is simplified and fluorescent labeling can also be in the linker DNA region. (B) Experimental scheme for labeling and imaging. (C) Image of single-nucleosome dots labeled with Cy3-dCTP in a live HeLa nucleus. The bar represents 1 μm. See also movies S1 and S2. (D) Oblique illumination microscopy system. Only a thin optical layer within the nucleus (red) was illuminated with a low background using a sheet light (green). The cartoon was reproduced and modified with permission from (18). (E) Representative single-step photobleaching of a Cy3-labeled nucleosome dot. The vertical axis represents the fluorescence intensity and the horizontal axis is the tracking time series. A.U., arbitrary units. (F) Three representative trajectories of single-nucleosomes. The bar represents 100 nm.

