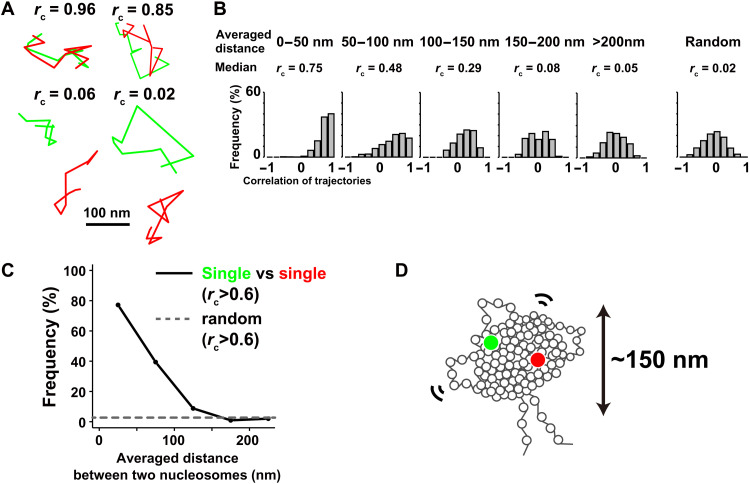
Fig. 5. Correlation analysis of motions of two neighboring nucleosomes.
(A) Four representative trajectory sets of two nucleosomes labeled with green (Alexa488-dUTP) and red (Cy3-dCTP). While the upper two sets show trajectories of two closely localized nucleosomes, the lower two represent distant nucleosomes. See also movies S5 to S8. (B) Histograms of congruence coefficient rc calculated between the two single-nucleosomes (green and red) whose averaged distances were in the ranges of 0 to 50 nm (median rc = 0.75), 50 to 100 nm (median rc = 0.48), 100 to 150 nm (median rc = 0.29), 150 to 200 nm (median rc = 0.08), and over 200 nm (median rc = 0.05) for 500 ms and the random control (median rc = 0.02). (C) Frequency plots of nucleosome pairs (green and red) with rc > 0.6 versus the pair distances. The dashed line shows the frequency of randomly collected nucleosome pairs with rc > 0.6. (D) Model of nucleosomes formed into a condensed domain with ~150 nm diameter.

