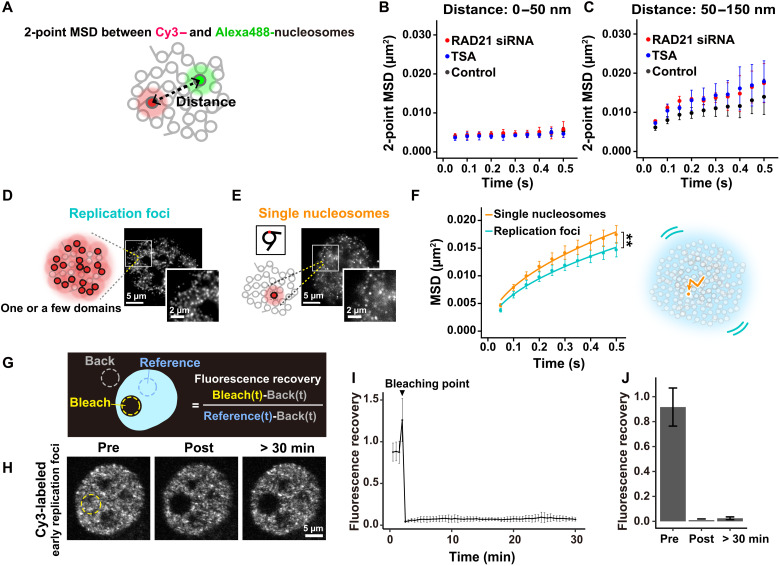
Fig. 7. Chromatin behaves differently at different spatiotemporal scales.
(A) Schematic for two-point MSD. (B) Two-point MSD plots (±SD among ≥3 clusters) between Cy3- and Alexa488-nucleosomes whose averaged distances (d) were 0 to 50 nm in living siRAD21-treated HeLa cells (red, 54 pairs), untreated cells (black, 84 pairs), and TSA-treated cells (blue, 42 pairs). Ten or more pairs were grouped as a cluster. (C) Two-point MSD plots (±SD among ≥3 clusters; d, 50 to 150 nm) in living siRAD21-treated HeLa cells (red, 33 pairs), untreated cells (black, 95 pairs), and TSA-treated cells (blue, 35 pairs). (D) Schematic for replication foci labeled with Cy3-dCTP at high concentrations (left) and their representative images in a living HeLa nucleus (right). The square region is magnified at lower right. Note that each dot corresponds to one replication focus, consisting of one or a few contact domains. Also see movie S15. (E) Schematic for single-nucleosome imaging and their typical representation. Note that each dot corresponds to a single-nucleosome. (F) MSD plots (±SD among cells) of early replication foci (light blue, n = 12 cells) and single-nucleosomes at the early replicated regions (orange, n = 19 cells) in living HeLa cells. **P < 0.001 by Kolmogorov-Smirnov test for foci versus single nucleosomes (P = 4.8 × 10⁻⁴). (G) Schematic for FRAP. (H) Representative images of Cy3-labeled early replication foci before, just after and 30 min after photobleaching. Photobleached region is shown by a yellow dotted line. XY-movement of the cell is corrected. (I) Mean normalized fluorescence intensity over time (fluorescence recovery curve) for Cy3-labeled early replication foci, n = 10 cells. (J) Mean normalized fluorescence intensity of photobleached region before, just after, and 30 min after photobleaching (n = 11 cells). Also see movie S16.

