Fig. 5.

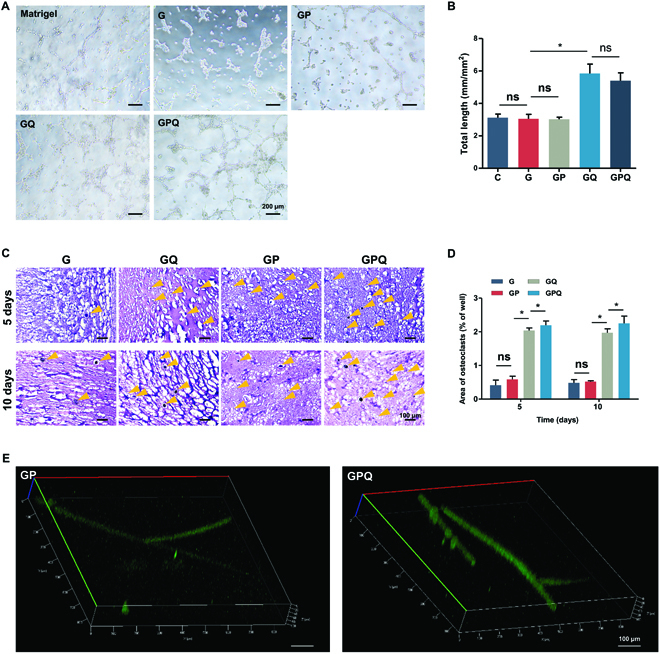
Characterizations of vascularization. (A) Tube formation assay of HUVECs in different groups. (B) Quantification of average parameters of tube formation. (C) H&E staining of hydrogels implanted into subcutaneous tissue of rat after 5 and 10 days. Blood vessels were marked with yellow arrowheads. (D) Quantification of the area of blood vessel formation. (E) Fluorescein isothiocyanate labeling of blood vessels formation in hydrogels that were implanted into subcutaneous tissue of rat after 10 days. *P < 0.05. ns, no significant difference.
