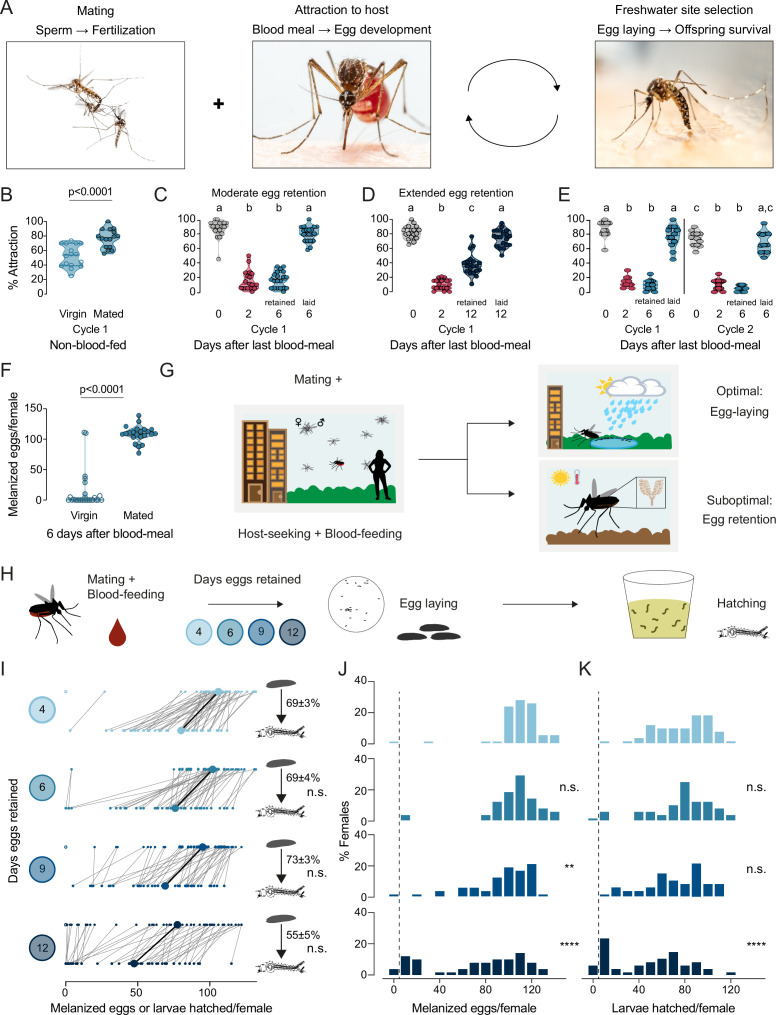
Figure 1. Aedes aegypti female reproduction is drought-resilient.
(A) Aedes aegypti male and female mating (left), female blood-feeding from a human host (center), and female laying eggs in water (right). (B–E) Attraction of wild type females to a human forearm at the indicated reproductive state and cycle. Females are mated for all host-seeking experiments except where specified in (B). Each point represents a single trial with ~20 females, n=12–20 trials/group. Data are plotted as violin plots with median and 1st/3rd quartiles and showing all data points. Data labeled with different letters are significantly different: (B) Unpaired t-test, p<0.0001. (C) Kruskal-Wallis, Dunn’s multiple comparisons test, p<0.05. (D, E) one-way ANOVA, Tukey’s multiple comparisons test, p<0.05. (F) Number of melanized eggs laid by mated or virgin females. Data points from single females, n=22–26 females/group, shown as a violin plot with median and 1st/3rd quartiles with all data points. Mann-Whitney test, p<0.0001. (G) Schematic of a female mosquito’s reproductive decision point after egg maturation under optimal and suboptimal egg-laying conditions of freshwater abundance and scarcity, respectively. (H) Schematic of experiment to test effect of egg retention on melanized egg laying and larval hatching. (I) Number of melanized eggs laid (top) and larvae hatched (bottom) by single females that experienced the indicated egg retention periods. Females laying no melanized eggs are depicted by open circles. Lines connect melanized eggs and hatched larvae from the same individual. Larger circles and bold lines represent medians. Numbers at right show hatching rate (mean ± S.E.M) from each egg retention group, n=46–50 females/group. (J, K) Distribution of melanized eggs (J) and larvae hatched (K) after the indicated length of egg retention, analyzed from data in (I). Zero values are binned separately for each group. All other bins are groups of 10 starting with [1-10] and with closed/inclusive intervals. The groups for number of melanized eggs (J), number of larvae hatched (K), and % hatched (I, numbers), respectively, at 6-, 9-, and 12 days post-blood-meal are compared to 4 days post-blood-meal to determine significant difference (Kruskal-Wallis, Dunn’s multiple comparison test; n.s.: not significant, p>0.05; **p<0.01; ****p<0.0001). Mosquito photographs (A): Alex Wild.


