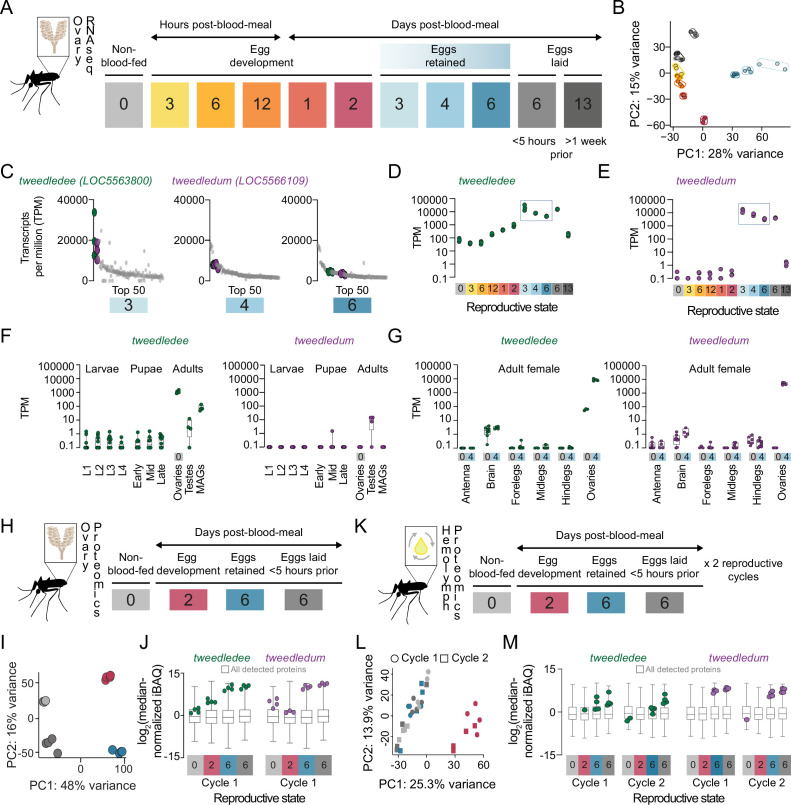
Figure 2. tweedledee and tweedledum are ovary-enriched and strongly upregulated during egg retention.
(A) Reproductive time-points sampled for bulk ovary RNA-sequencing (RNA-seq), n=3 replicates/group, 11 groups. (B) Principal component analysis (PCA) of DESeq2-normalized, transformed counts from ovary RNA-seq. (C) Top 50 most abundant transcripts ranked by median transcripts per million (TPM) for egg retention groups, 3-, 4-, and 6 days post-blood-meal (total = 150 transcripts). Gray dots represent replicates for each transcript in the top 50, green dots indicate tweedledee, and purple dots represent tweedledum. (D–E) Transcript expression pattern in the ovaries of tweedledee (D) and tweedledum (E). The blue rectangle indicates the period of egg retention. (F) TPM values for tweedledee (left) and tweedledum (right) during larval, pupal, and adult stages of development [data from Matthews et al., 2018], MAGs = male accessory glands, n=4–13 replicates/group. (G) TPM values for tweedledee (left) and tweedledum (right) in adult female tissues (data originally from Matthews et al., 2016), reanalyzed in Matthews et al., 2018, n=3–8 replicates/group. (H) Reproductive time-points sampled for ovary proteomics, n=4 replicates/group, 4 groups. (I) PCA of iBAQ values from ovary proteomics. (J) Distribution of iBAQ values as a metric of abundance for all proteins detected per group in ovary proteomics. Overlaid green dots represent individual replicate values for tweedledee and purple dots represent replicates for tweedledum. All values are pre-imputation and represent log2-transformed median iBAQ signals normalized by subtracting the median iBAQ signal for the group. (K) Reproductive time-points sampled for hemolymph proteomics, n=4 replicates/group, 8 groups. (L) PCA of iBAQ values from hemolymph proteomics. (M) Distribution of iBAQ values as a metric of abundance for all proteins detected per group in hemolymph proteomics. Overlaid green dots represent individual replicate values for tweedledee and purple dots represent replicates for tweedledum. All values are pre-imputation and represent log2-transformed median iBAQ signals normalized by subtracting the median iBAQ signal for the group. Box plots in F, G, J, M: median, 1st/3rd quartile, minimum to maximum whiskers.

