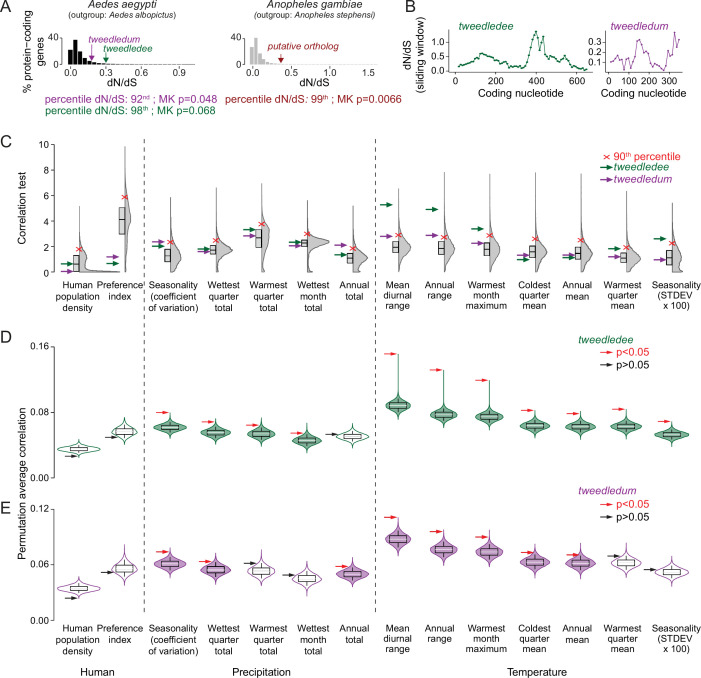
Figure 5. tweedledee and tweedledum are rapidly evolving and may be subject to climate variability-driven selective pressures.
(A) The distribution of dN/dS values for 8,030 protein-coding genes in Aedes aegypti (outgroup: Aedes albopictus) and 9,958 protein-coding genes in Anopheles gambiae (outgroup: Anopheles stephensi). tweedledee, tweedledum and the Anopheles gambiae putative ortholog are shown with arrows. (B) dN/dS values were calculated for a 102-nucleotide sliding window size of 34 nucleotides each with a 3 amino acid overlap across the coding sequence of Aedes aegypti tweedledee and tweedledum. Coding sequences were aligned to orthologs in Aedes albopictus. (C) Correlation test for 12 bioclimatic and 2 anthropological variables (total=14 ecological variables) calculated using all genetic variants. The distributions of 14,438 protein-coding genes in Aedes aegypti are plotted with Correlation Test calculated and plotted on the y-axis using the following formula: -log10(harmonic mean combined Pearson’s correlation p-value). Individual Pearson’s correlation for all genetic variants in all protein-coding genes were included in the calculation. Boxes show median and 1st/3rd quartiles. Red X indicates 90th percentile. Violin tails extend to show the entire range of data points. The positions of tweedledee (green) and tweedledum (purple) are indicated by arrows. (D, E) Permutation tests were conducted for tweedledee (D) and tweedledum (E). Genetic variants were randomly sampled from all protein-coding genes to simulate 10,000 genes with the same number of genetic variants as either tweedledee (358) or tweedledum (292). Boxes show median and 1st/3rd quartiles and whiskers extend to the 5th/95th percentiles. Significance was measured using p<0.05 (above the 95th percentile). Violin tails extend to show the entire range of data points. The positions of tweedledee (D) and tweedledum (E) are indicated by an arrow. Significance is indicated by arrow color (red: p<0.05; black: p>0.05). Violins with p<0.05 are shaded green for tweedledee (D) or purple for tweedledum (E).


