
Fig. 1.
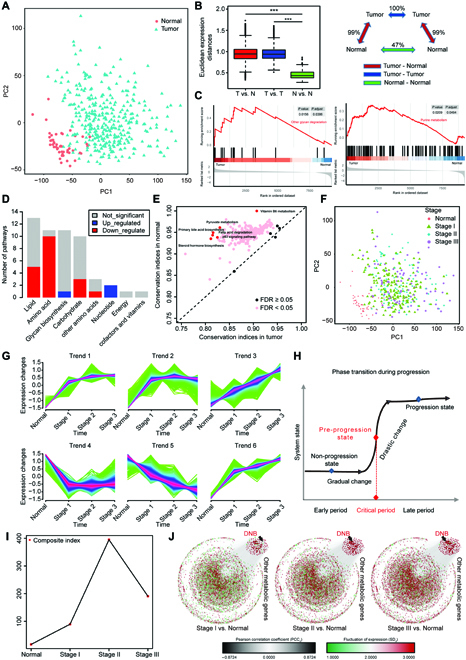
Metabolic dysregulation and dynamic changes in HCCs. (A) PCA of HCC tumor tissues (n = 343) and paired normal tissues (n = 49) in the TCGA-HCC cohort. (B) Global differences in metabolic gene expression between HCC tumors and normal tissues in the TCGA-HCC cohort. The Euclidean expression distances were calculated between tumors and normal tissues (red), within samples of tumor tissues (blue), and within samples of normal tissues (green). The inset summarizes the average distances between pairs of tissues as a percentage of the average distance between tumors and normal tissues. (Level of significance: ***P < 0.001.) (C) A representative GSEA plot showing significantly dysregulated glycan degradation (left) and purine metabolism (right) in the tumors versus normal tissues in the TCGA-HCC cohort. (D) The number of metabolic pathways that were significantly dysregulated (FDR < 0.05) in the tumors versus normal tissues in the TCGA-HCC cohort among each of 8 metabolic categories. The X-axis represents metabolic categories where metabolic pathways were classified according to the KEGG database. The Y-axis represents the number of pathways classified into corresponding category. (E) Comparison of the RCI of metabolic pathways between tumors and normal tissues in the TCGA-HCC cohort. FDR < 0.05 indicates differentially regulated pathways between tumors and normal tissues in the TCGA-HCC cohort. (F) PCA of HCC tumors at different stage and paired normal tissues in the TCGA-HCC cohort. (G) The series of diagrams depicts the dynamic changes pattern of 9193 metabolic genes during different stages in the TCGA-HCC cohort, using Mfuzz. (H) A schematic diagram illustrates a stage transition during HCC progression. The critical period after the early period changes the state of the biological system qualitatively and thus plays a key role in biological processes. (I) The graph illustrates that the critical transition occurs at Stage II of HCC, according to CIs over all time points in gene expression profiling. (J) The series of networks shows that the 3 criteria of DNB were satisfied at Stage II of HCC from dynamic changes in gene expression.