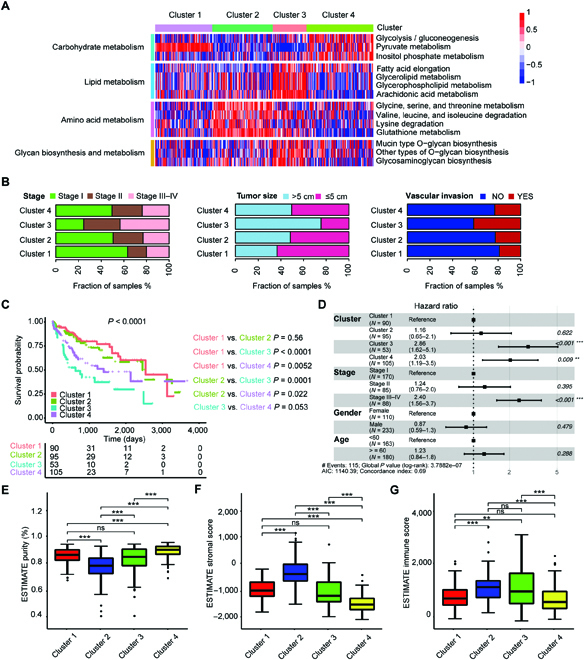
Fig. 2.

Metabolic clusters of HCC based on DNBs. (A) The clustering results based on the enrichment scores of 227 DNBs of HCC tumors in the TCGA-HCC cohort. Heatmap shows normalized enrichment scores of the 4 metabolic clusters. (B) Bar plots show the distribution of HCC clinical characteristics, including disease stage, tumor size, and condition of vascular invasion among the 4 metabolic clusters. (C) Kaplan–Meier curves of survival among the 4 metabolic clusters in the TCGA-HCC cohort. Log-rank test and BH method for adjusting P value. Among all clusters, P < 0.0001; cluster 1 versus cluster 2, P = 0.56; cluster 1 versus cluster 3, P < 0.0001; cluster 1 versus cluster 4, P = 0.0052; cluster 2 versus cluster 3, P = 0.0001; cluster 2 versus cluster 4, P = 0.022; cluster 3 versus cluster 4, P = 0.053. (D) Forest plot of multivariate Cox regression analysis for survival adjusting for disease stage, gender, age, and metabolic clusters in the TCGA-HCC cohort. The hazard ratios are shown with 95% confidence intervals. ***P < 0.001; **P < 0.01; ns, P > 0.05. (E to G) Boxplots show the distribution of tumor purity (E), stromal score (F), and immune score (G) among the 4 clusters. Tukey’s post hoc test. (Level of significance: ***P < 0.001; **P < 0.01; ns, P > 0.05.)
