
Fig. 5.
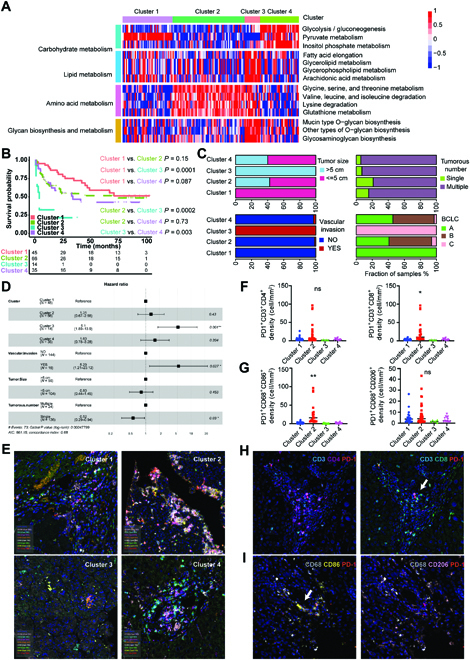
Immune characteristics of metabolic clusters in HCCs. (A) The clustering results based on the enrichment scores of 227 DNBs of HCC tumors in the TCGA-HCC cohort. Heatmap shows normalized enrichment scores of the 4 metabolic clusters in the ZS-HCC cohort. (B) Kaplan–Meier curves of survival among the 4 metabolic clusters in the ZS-HCC cohort. Log-rank test and BH method for adjusting P value. Among all clusters, P < 0.01; cluster 1 versus cluster 2, P = 0.15; cluster 1 versus cluster 3, P = 0.0001; cluster 1 versus cluster 4, P = 0.087; cluster 2 versus cluster 3, P = 0.0002; cluster 2 versus cluster 4, P = 0.73; cluster 3 versus cluster 4, P = 0.003. (C) Bar plots show the distribution of HCC clinical characteristics among the 4 clusters in the ZS-HCC cohort. (D) Forest plot of multivariate Cox regression analysis for survival adjusting for condition of vascular invasion, tumor size, tumor numbers, and metabolic clusters in the ZS-HCC cohort. The hazard ratios are shown with 95% confidence intervals. *P < 0.05; **P < 0.01; ns, P > 0.05. (E) Representative multispectral images of 8 markers on HCC tumor tissues of the 4 clusters in the ZS-HCC cohort. 4′,6-diamidino-2-phenylindole: cyan; CD3: blue; CD4: purple; CD8: green; CD68: white, CD86: yellow; CD20: pink; CD56: orange; and PD-1: red. (F and G) The number or fraction of PD-1+ CD4+ T cells (CD3/CD4/PD-1) and cytotoxic T cells (CD3/CD8/PD-1)(F) or PD-1+ M1 macrophages (CD68/CD86/PD-1) and M2 macrophages (CD68/CD206/PD-1) (G) to investigate which type of immune cells is the main resource for PD-1. (H and I) Representative images of immune cells in cluster 2, (H) CD4+ T cells (CD3/CD4/PD-1) and cytotoxic T cells (CD3/CD8/PD-1); (I) M1 macrophages (CD68/CD86/PD-1) and M2 macrophages (CD68/CD206/PD-1).