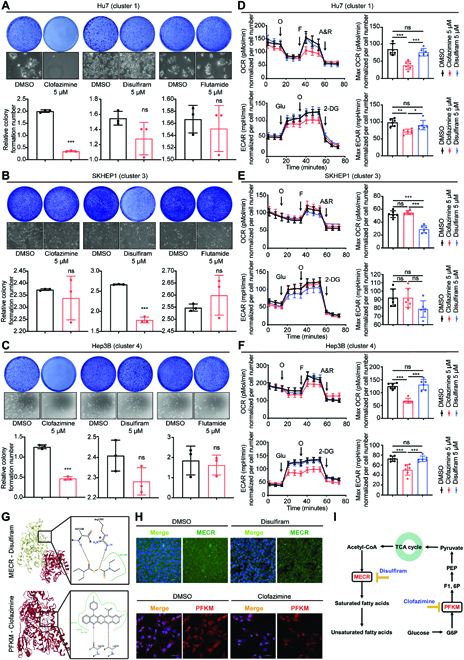
Fig. 6.

Metabolic clusters have distinct sensitivity to various drugs. (A to C) Representative pictures of colony formation assays and quantification of colony formation assays with different drug treatments in Hu7 (A), SKHEP1 (B), and Hep3B (C). Data are presented as the means ± SD of 3 independent experiments; Student’s test. (D to F) Oxygen consumption rate (OCR) and extracellular acidification rate (ECAR) levels were measured using the Seahorse assay, and the basal/maximal respiration and glycolysis levels were calculated accordingly with different drug treatments in Hu7 (D), SKHEP1 (E), and Hep3B (F). Data are shown as the means ± SD of 6 independent experiments; 1-way analysis of variance and Tukey’s post hoc test. (G) Molecular docking simulation between protein and drug. Upper, MECR and disulfiram; lower, PFKM and clofazimine. (H) Changes in MECR or PFKM with disulfiram or clofazimine treatment were detected by immunofluorescence assay. (I) Schematic pathway showing the targets of clofazimine and disulfiram in metabolism. (Level of significance: ***P < 0.001; **P < 0.01; *P < 0.05; ns, P > 0.05.)
